

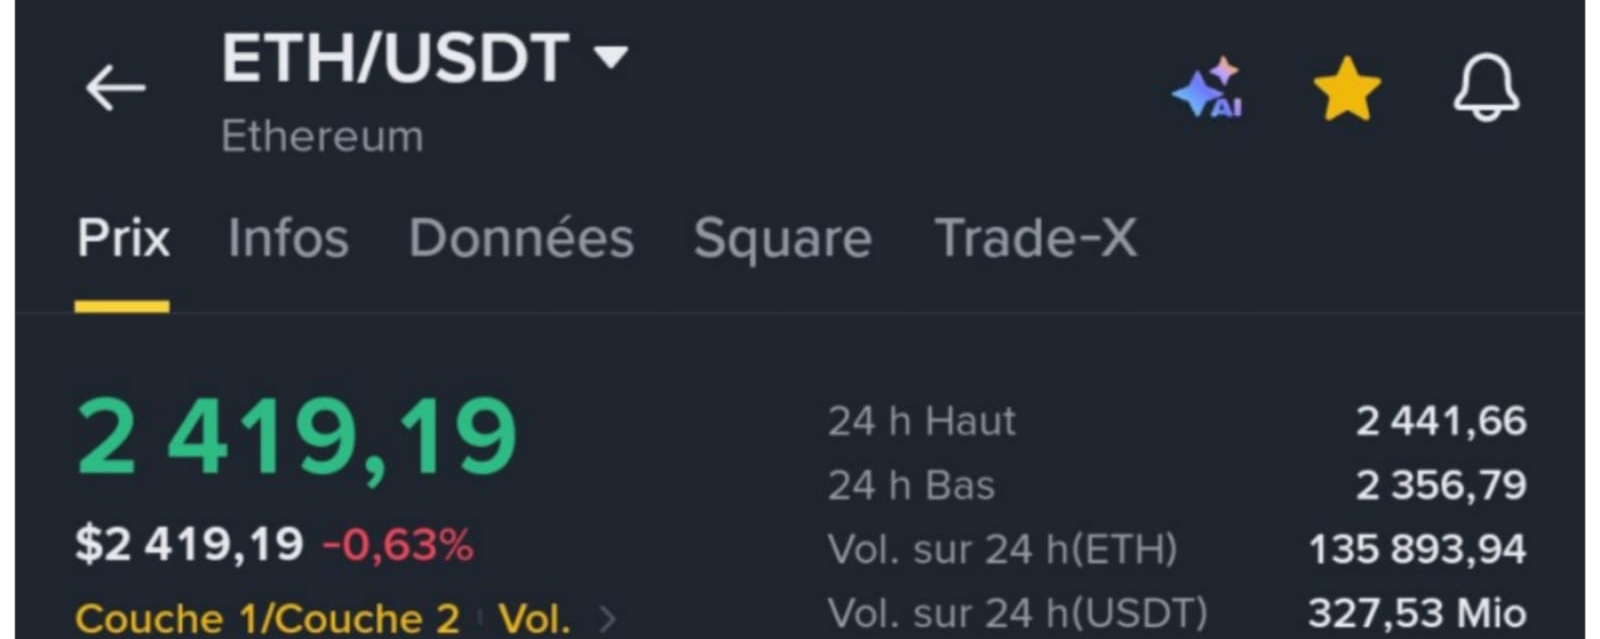

⚠️ This is an educational SIMULATION. No real money is involved. This is not investment advice.
I'm putting the exercise from the article in the comments into practice: 10 simulated trades, recorded in a journal, to understand the principle and spot my mistakes before risking anything.
🕐 **Analysis completed on 18/10/2026 at 10:30 (UTC+1) = 09:30 (UTC)**
What I see in my ETH screenshots
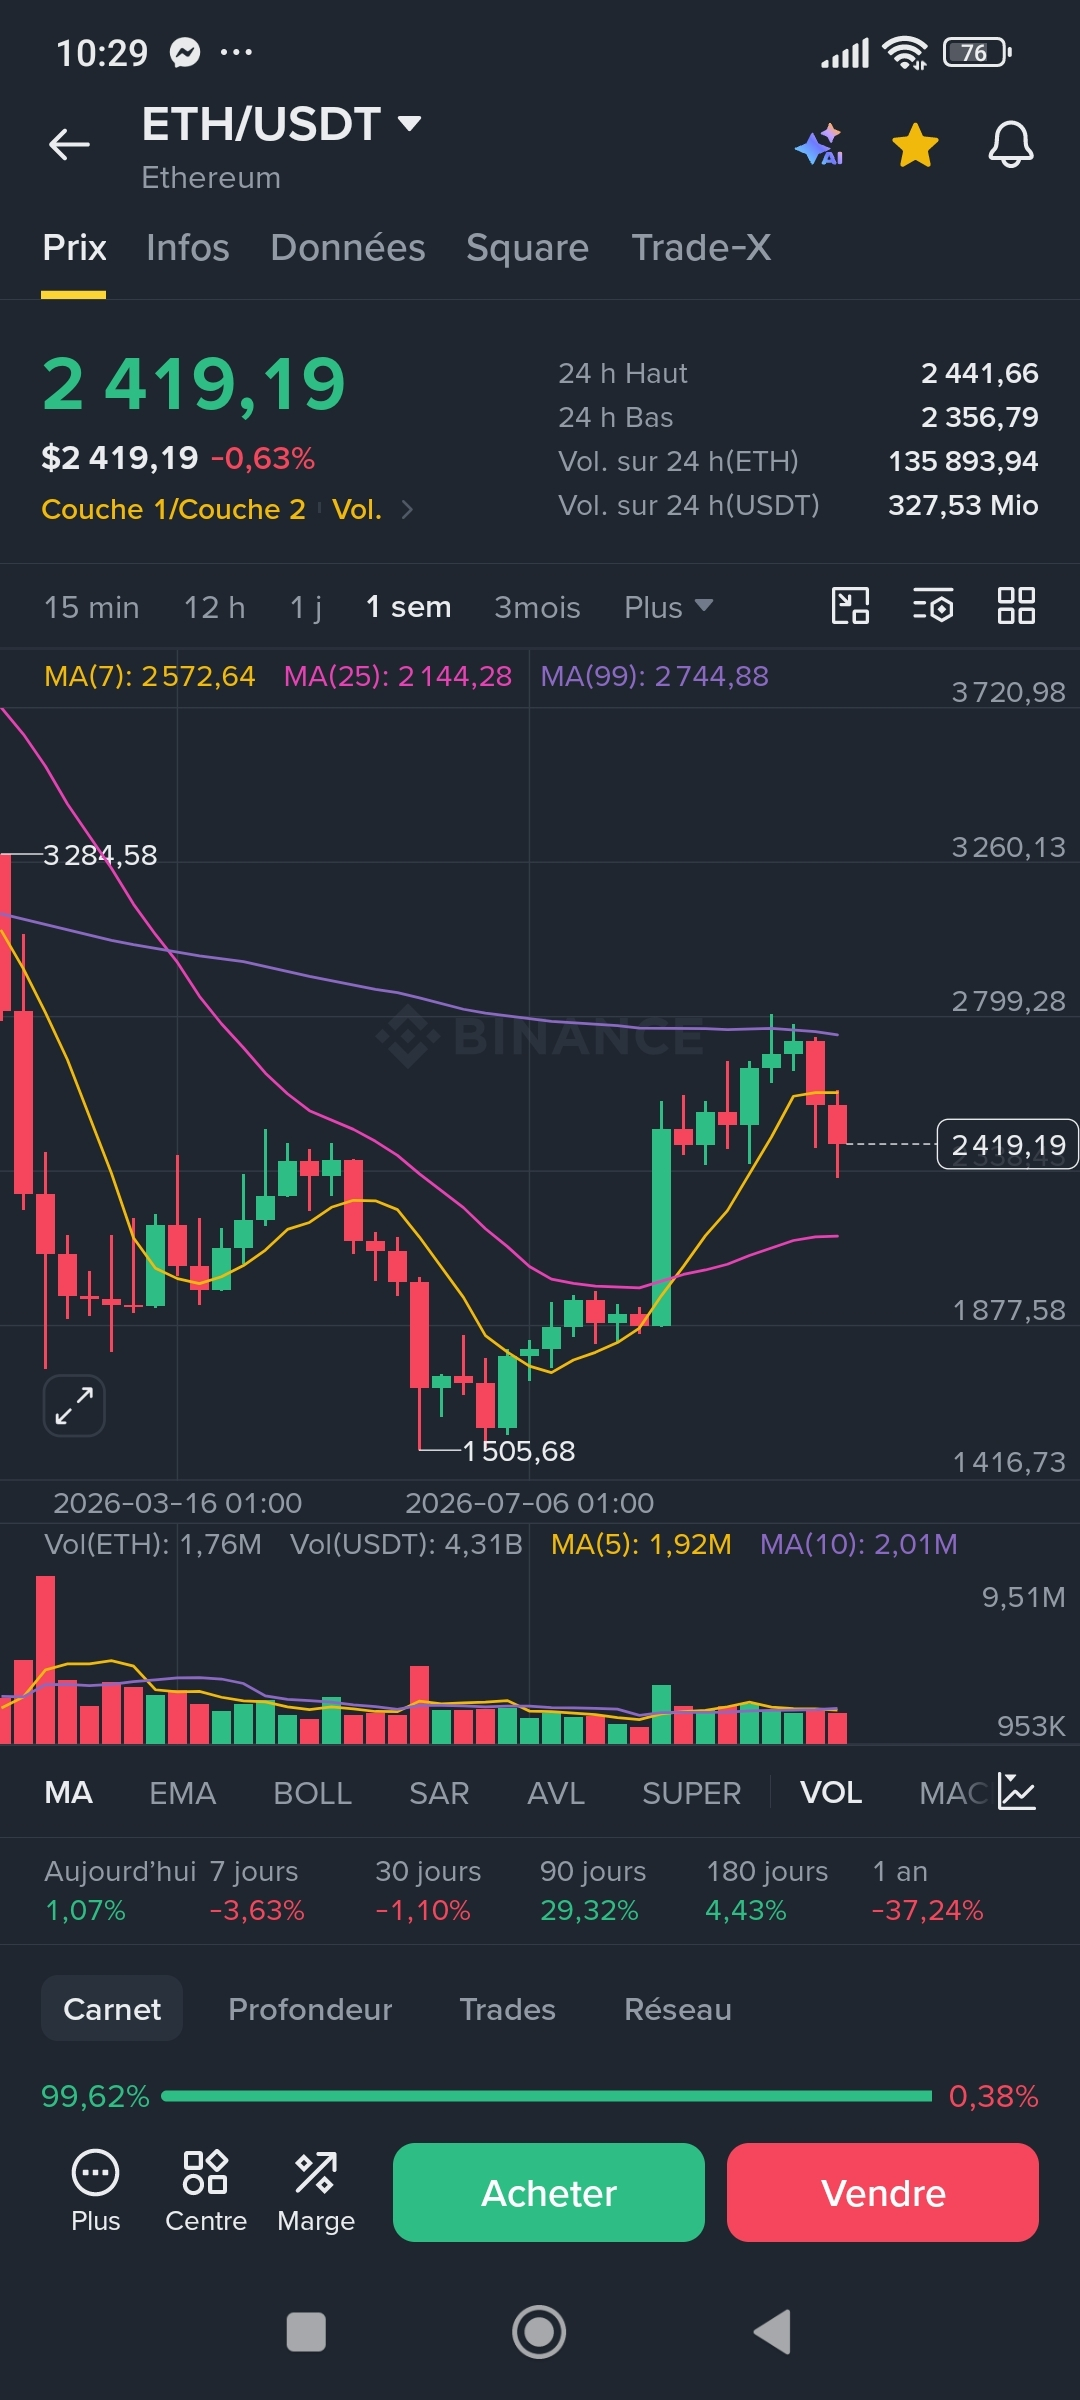
• Week: each candle = one week. ETH was at around 3,284, dropped to 1,505, then rebounded strongly.
This rebound stopped around 2 750 – 2 800, where the purple line (99-period moving average) runs. This zone acted as resistance: the price couldn’t break through it. This is exactly what the article calls a “price zone.”
Since then, two red candles: the price has dropped back to 2 419. Over the past year, ETH is still down (−37%), so the broader trend remains bearish.
Lower down, the pink line (≈ 2 144) could act as support: a zone where the price may stop falling.
Here’s my chart reading, followed by my first journal entry.
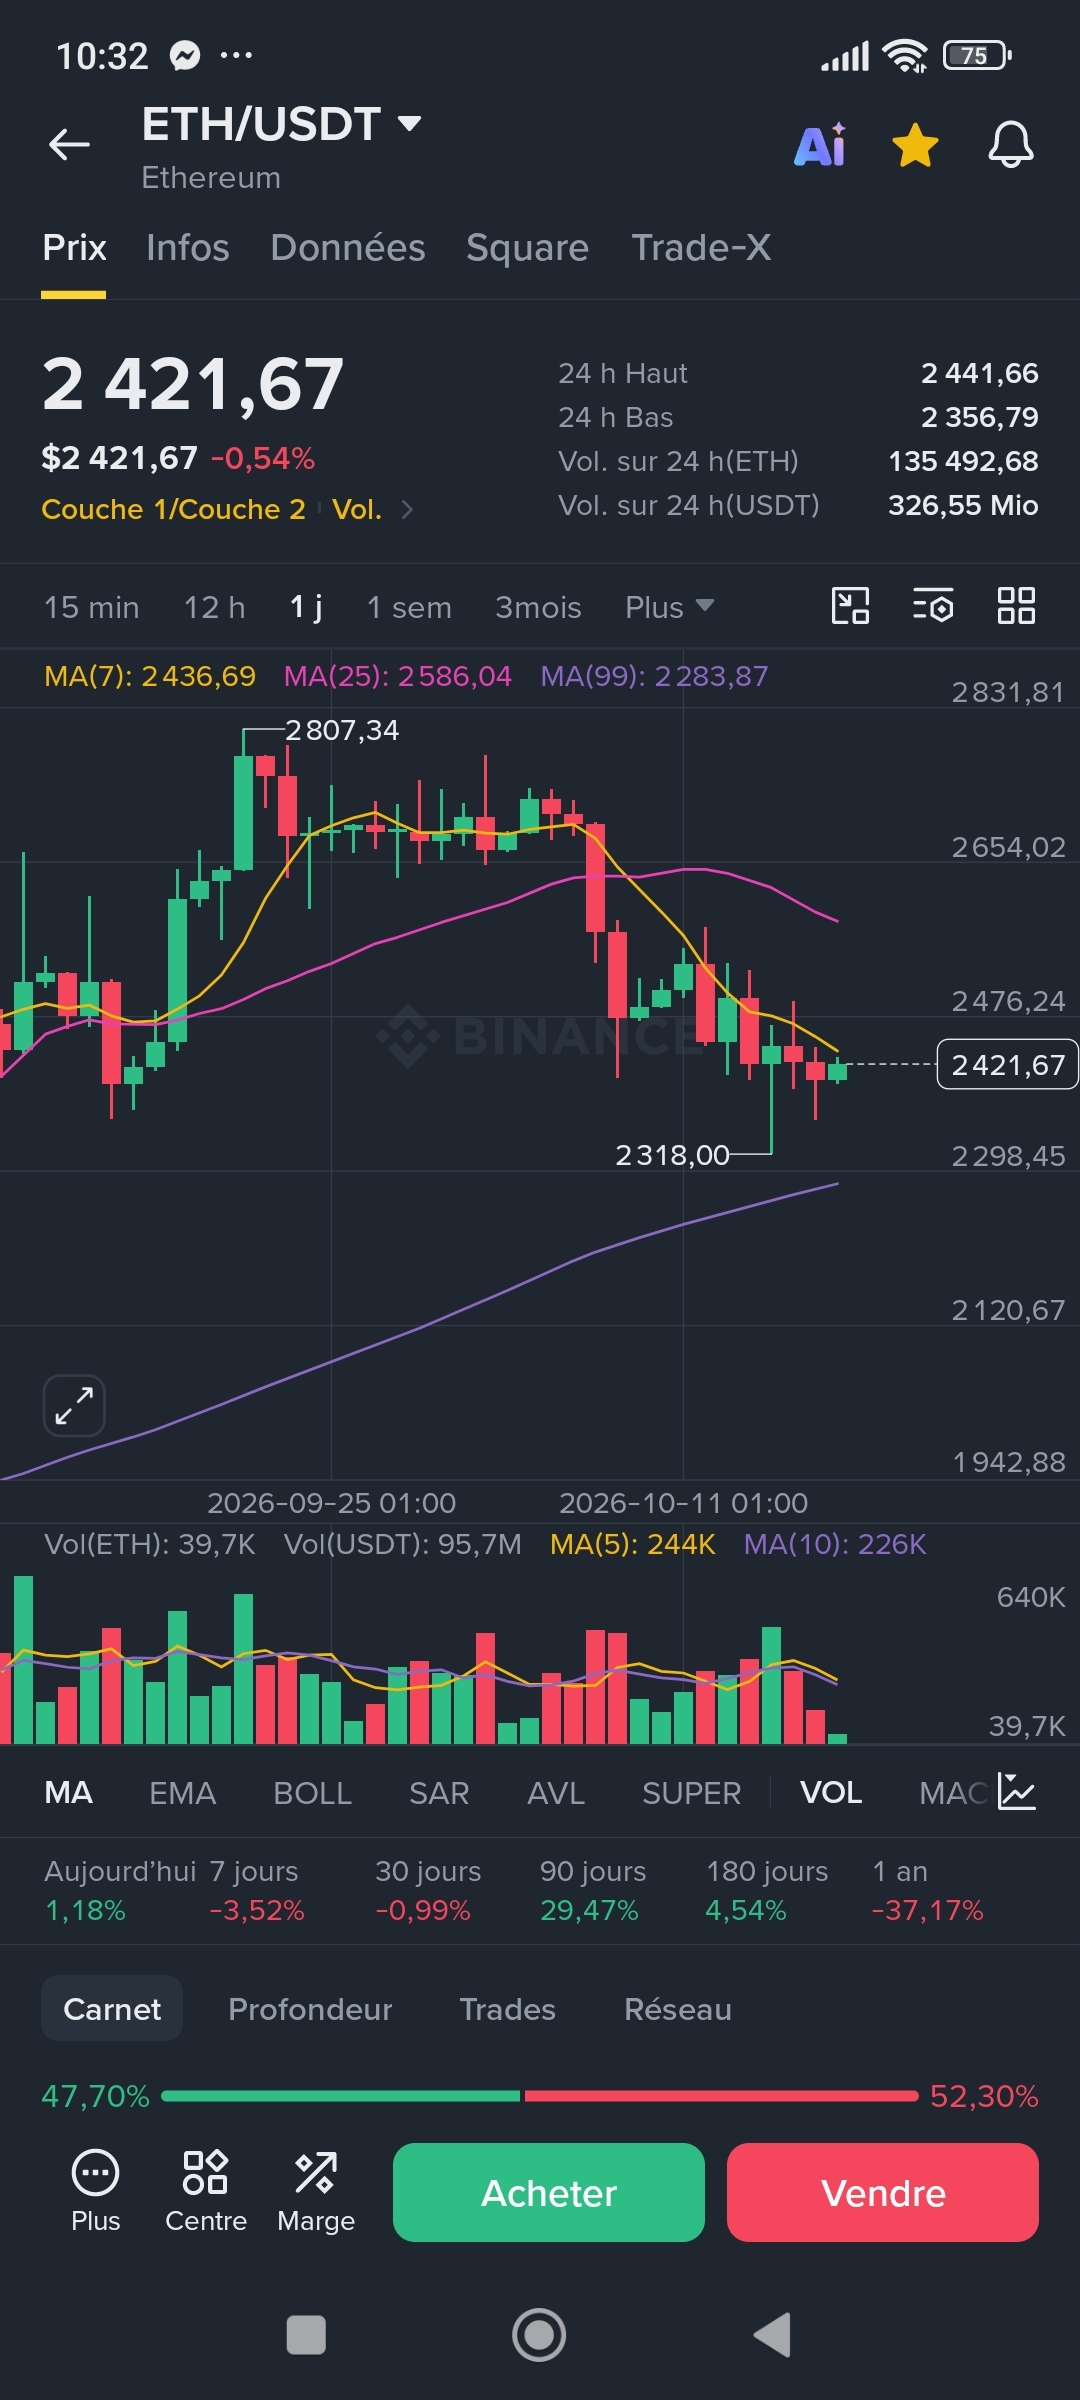
• Daily (1D): bearish in the short term
ETH rose to 2 807, then fell back to 2 318. The highs and lows are getting lower, which is a sign of a decline.
The price is below the pink line (2 586) but still above the rising purple line (2 284). So this is a pause, not a collapse.
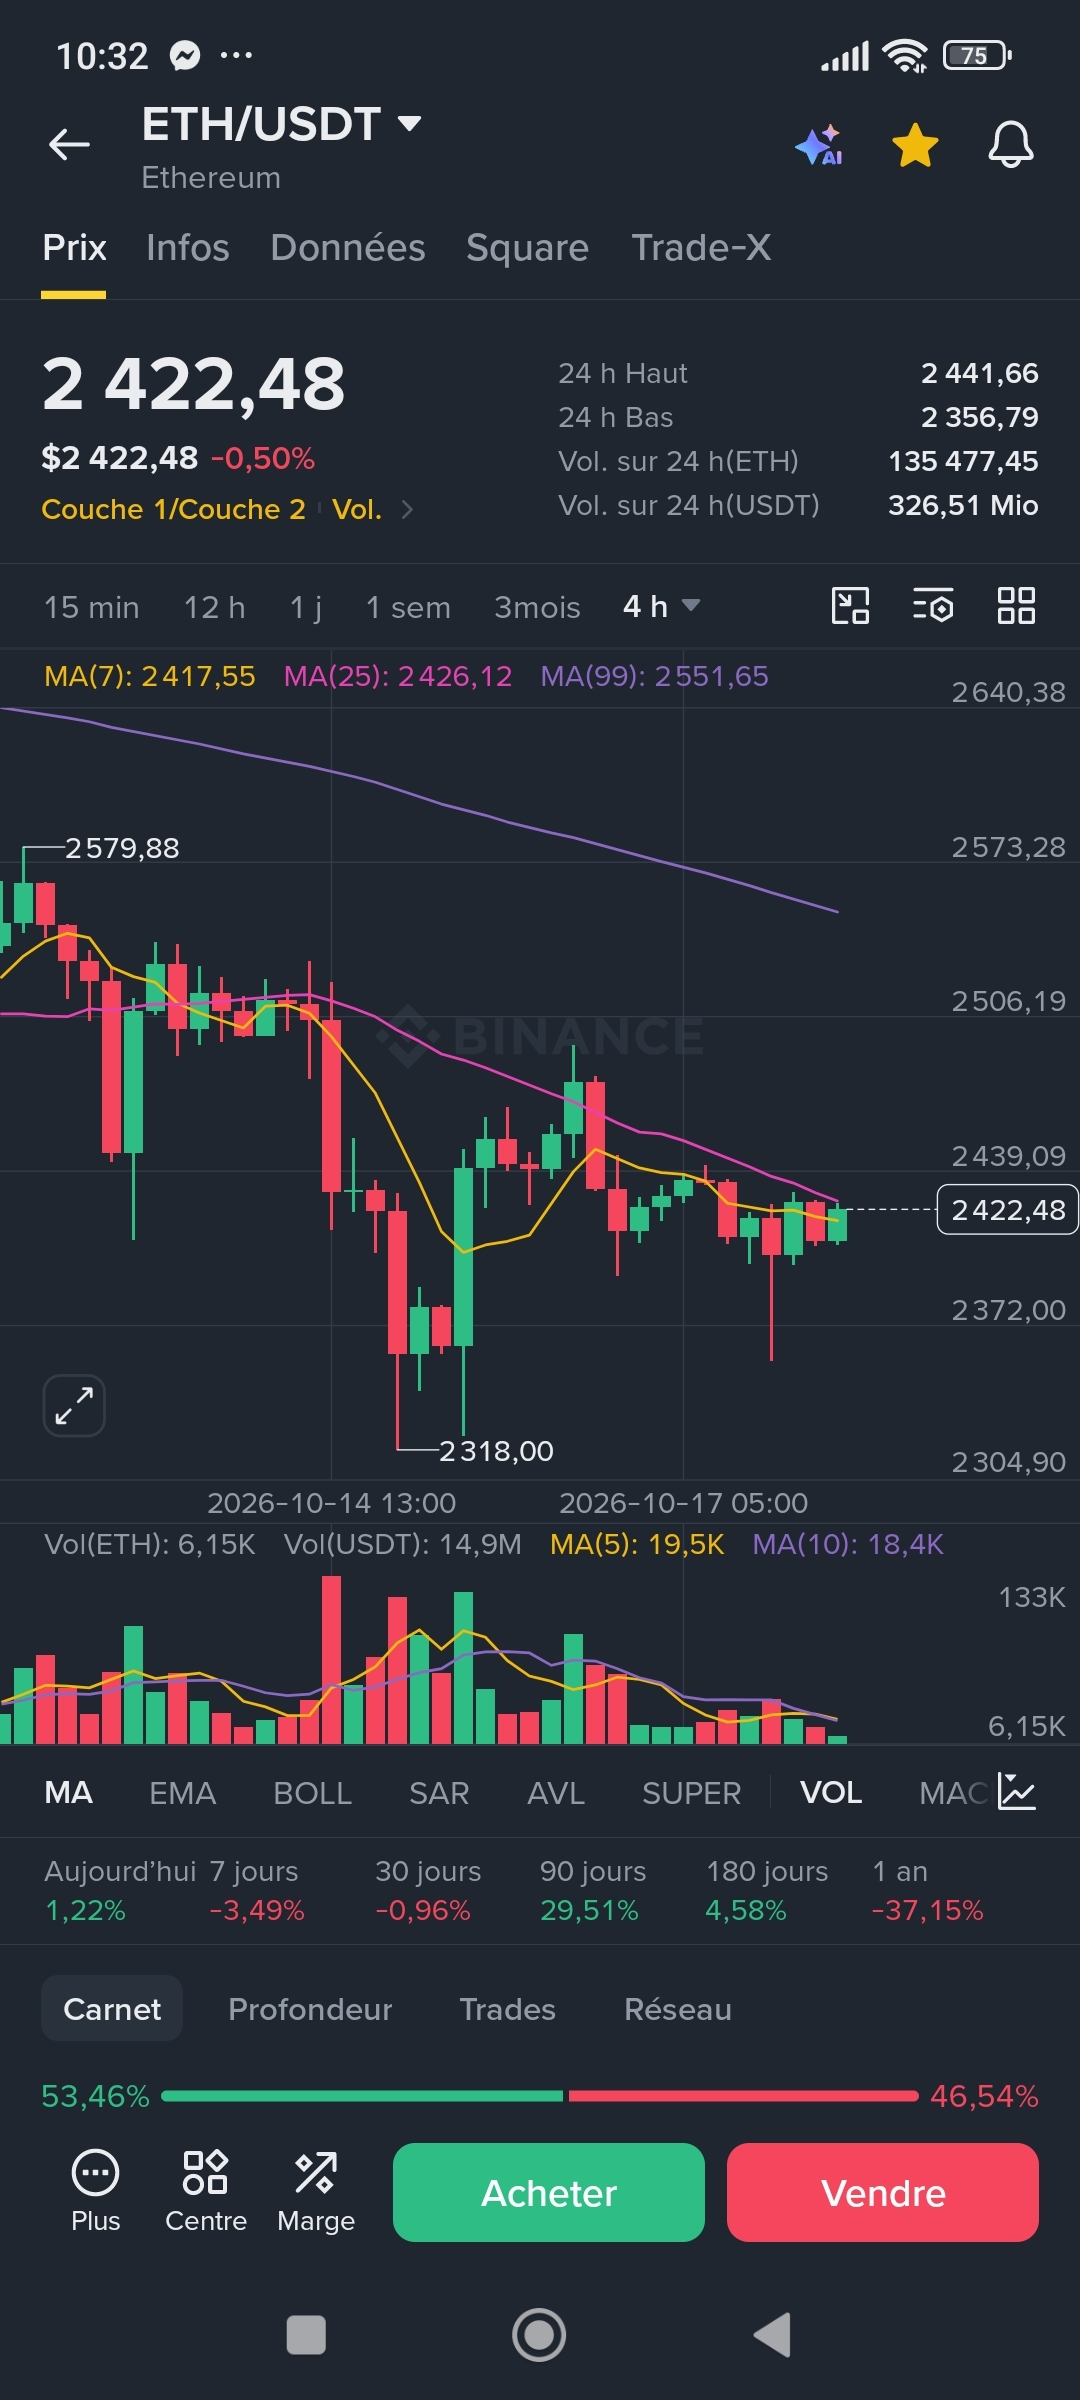
• 4H: a zone of indecision
After dropping to around 2 318, the price rebounded to about 2 540, then fell again.
Since then, the candles have been small and overlapping around 2 400 – 2 440. This is the “overlapping candles” the article talks about: the market is undecided, so we avoid entering.
Key zones: support ≈ 2 318, resistance ≈ 2 540 (where the purple line runs).
My trade journal entry 1 (simulated trade on 10/18/2026)
1. ETHUSDT 4H, 10/18/2026
2. Daily: bearish
3. 4H structure: overlapping candles
4. Zone: middle of the zone (between support and resistance)
5. Signal candle: none, only small bodies
6. DXY: to be filled in later
7. Hypothetical entry 2 430, stop 2 310, target 2 550
8. Risk/reward: risking 120 to gain 120, or 1:1 (the article recommends at least 1:2)
9. Hypothetical risk: 1%
10. Decision: Skip
11. Result: no entry
12. Main mistake: entering in the middle of the zone + insufficient risk/reward ratio
For this first trade, the right decision is not to enter, and it still counts as 1 out of 10.
None of this is a prediction or advice; it's a chart-reading exercise.
Here, the chart reading is different from ETH.
What I see in my BNB screenshots
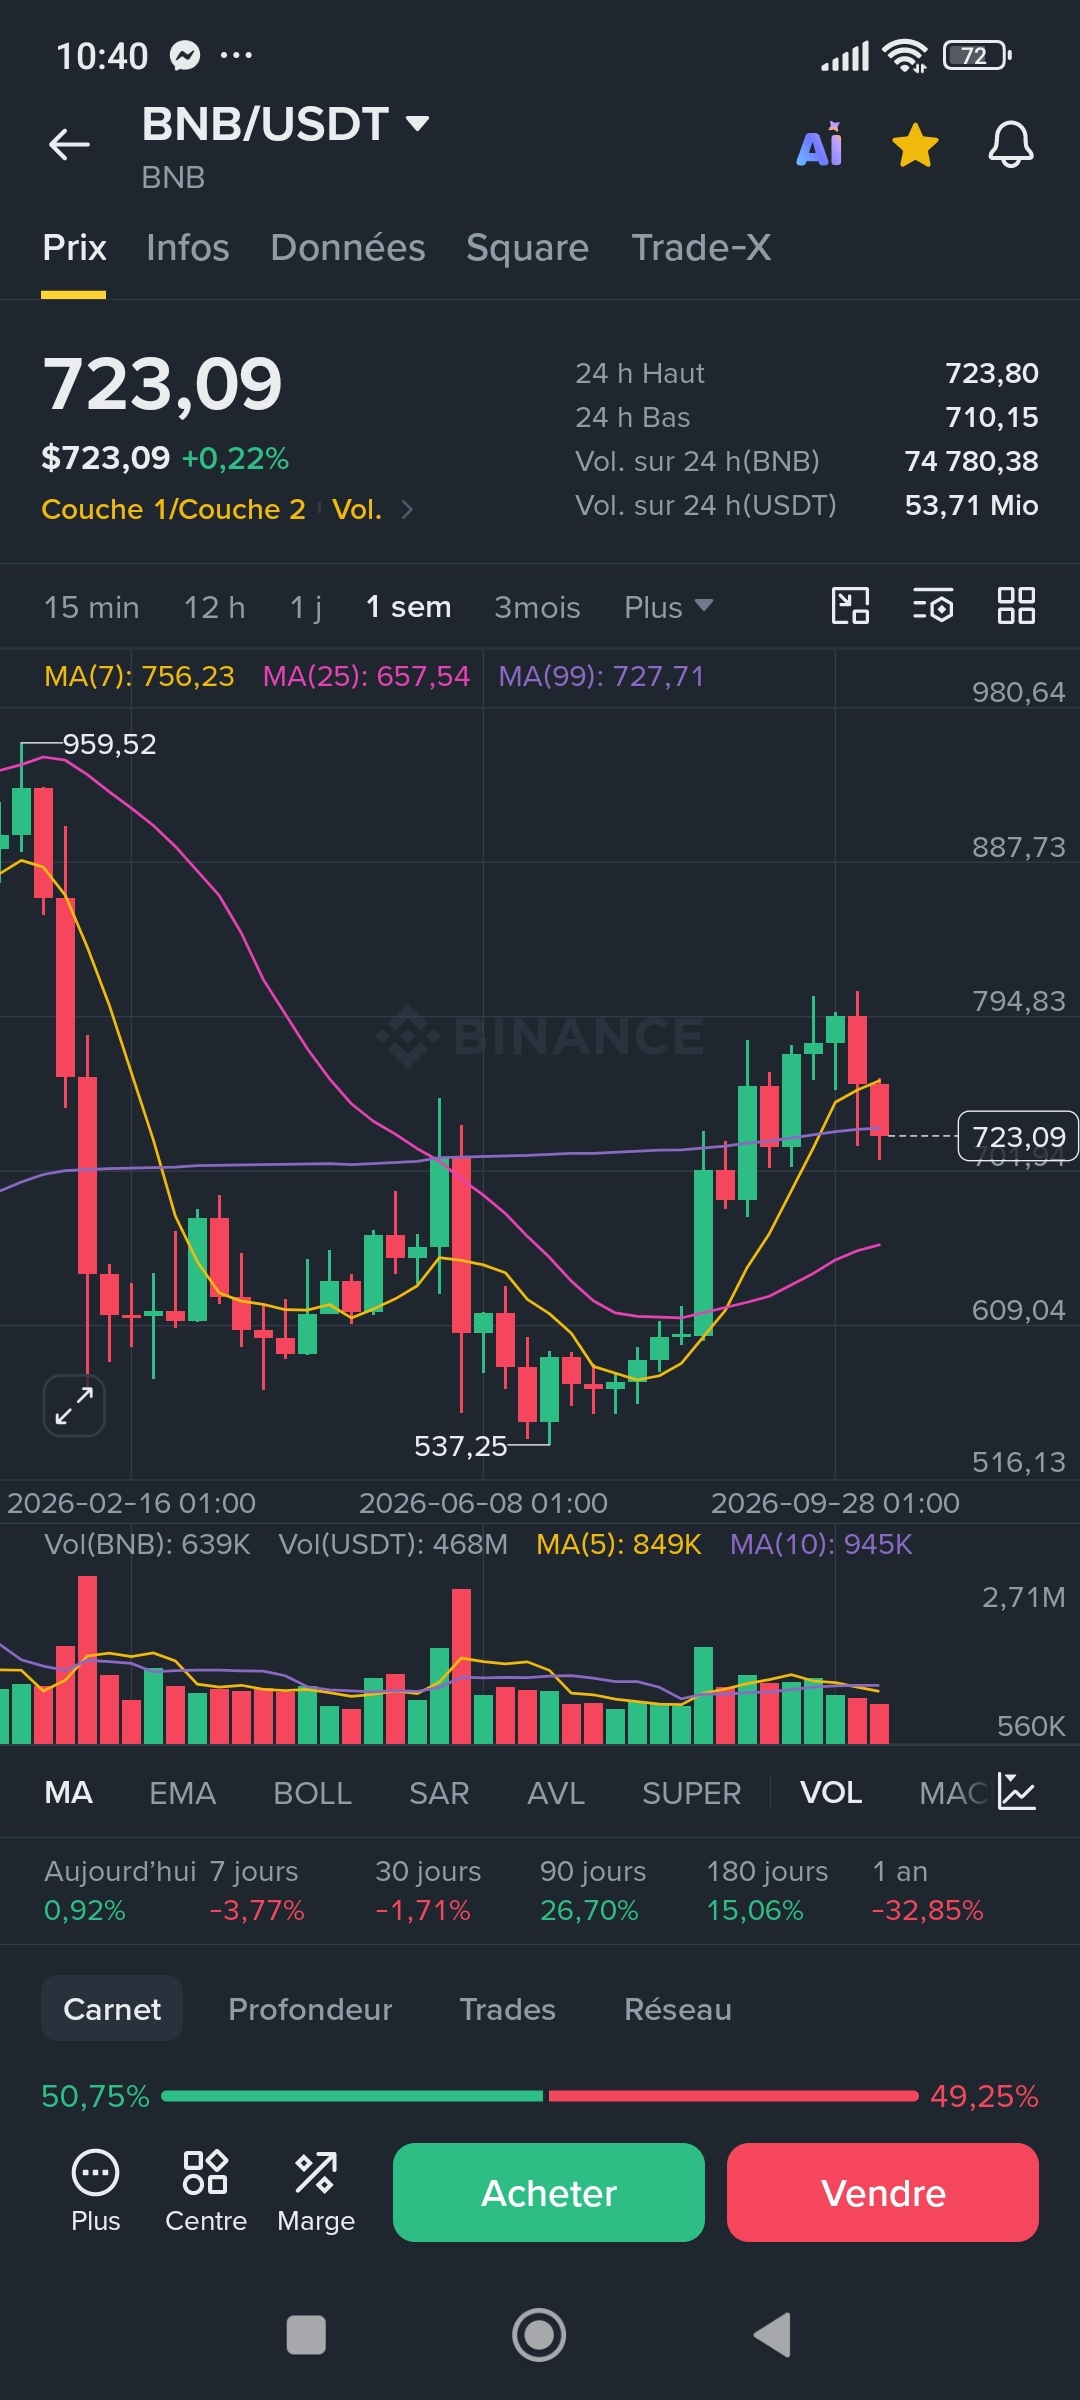
• Weekly: BNB fell from 959 to 537, then rebounded. The price (723) is right on the purple line (≈ 727), an important zone to watch.
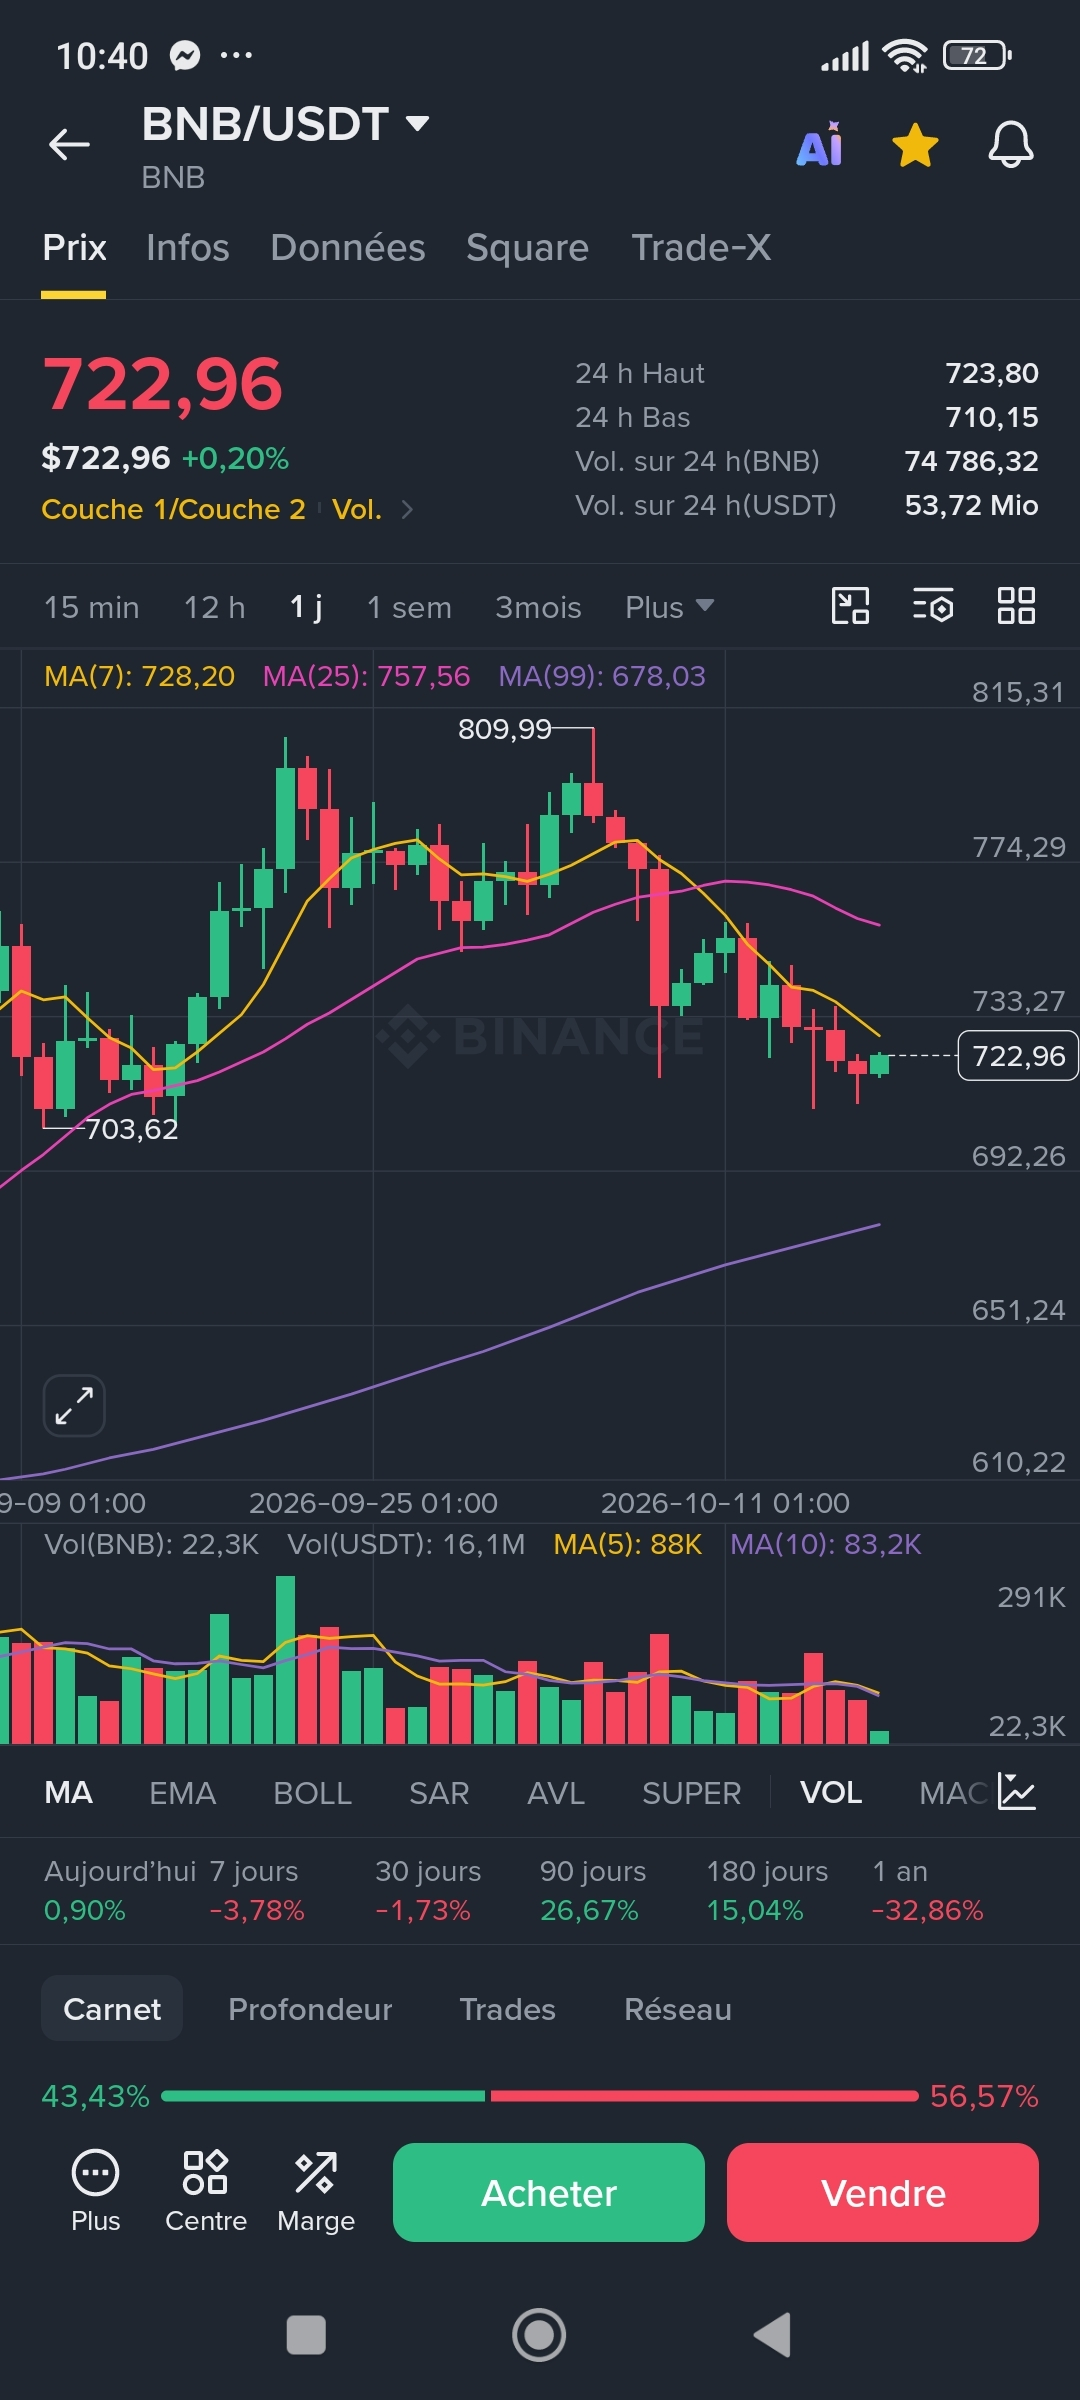
• Daily: a high at 810, followed by a decline. The price is below the yellow and pink lines, but above the rising purple line (678). As with ETH, this is a short-term decline within a broader rebound.
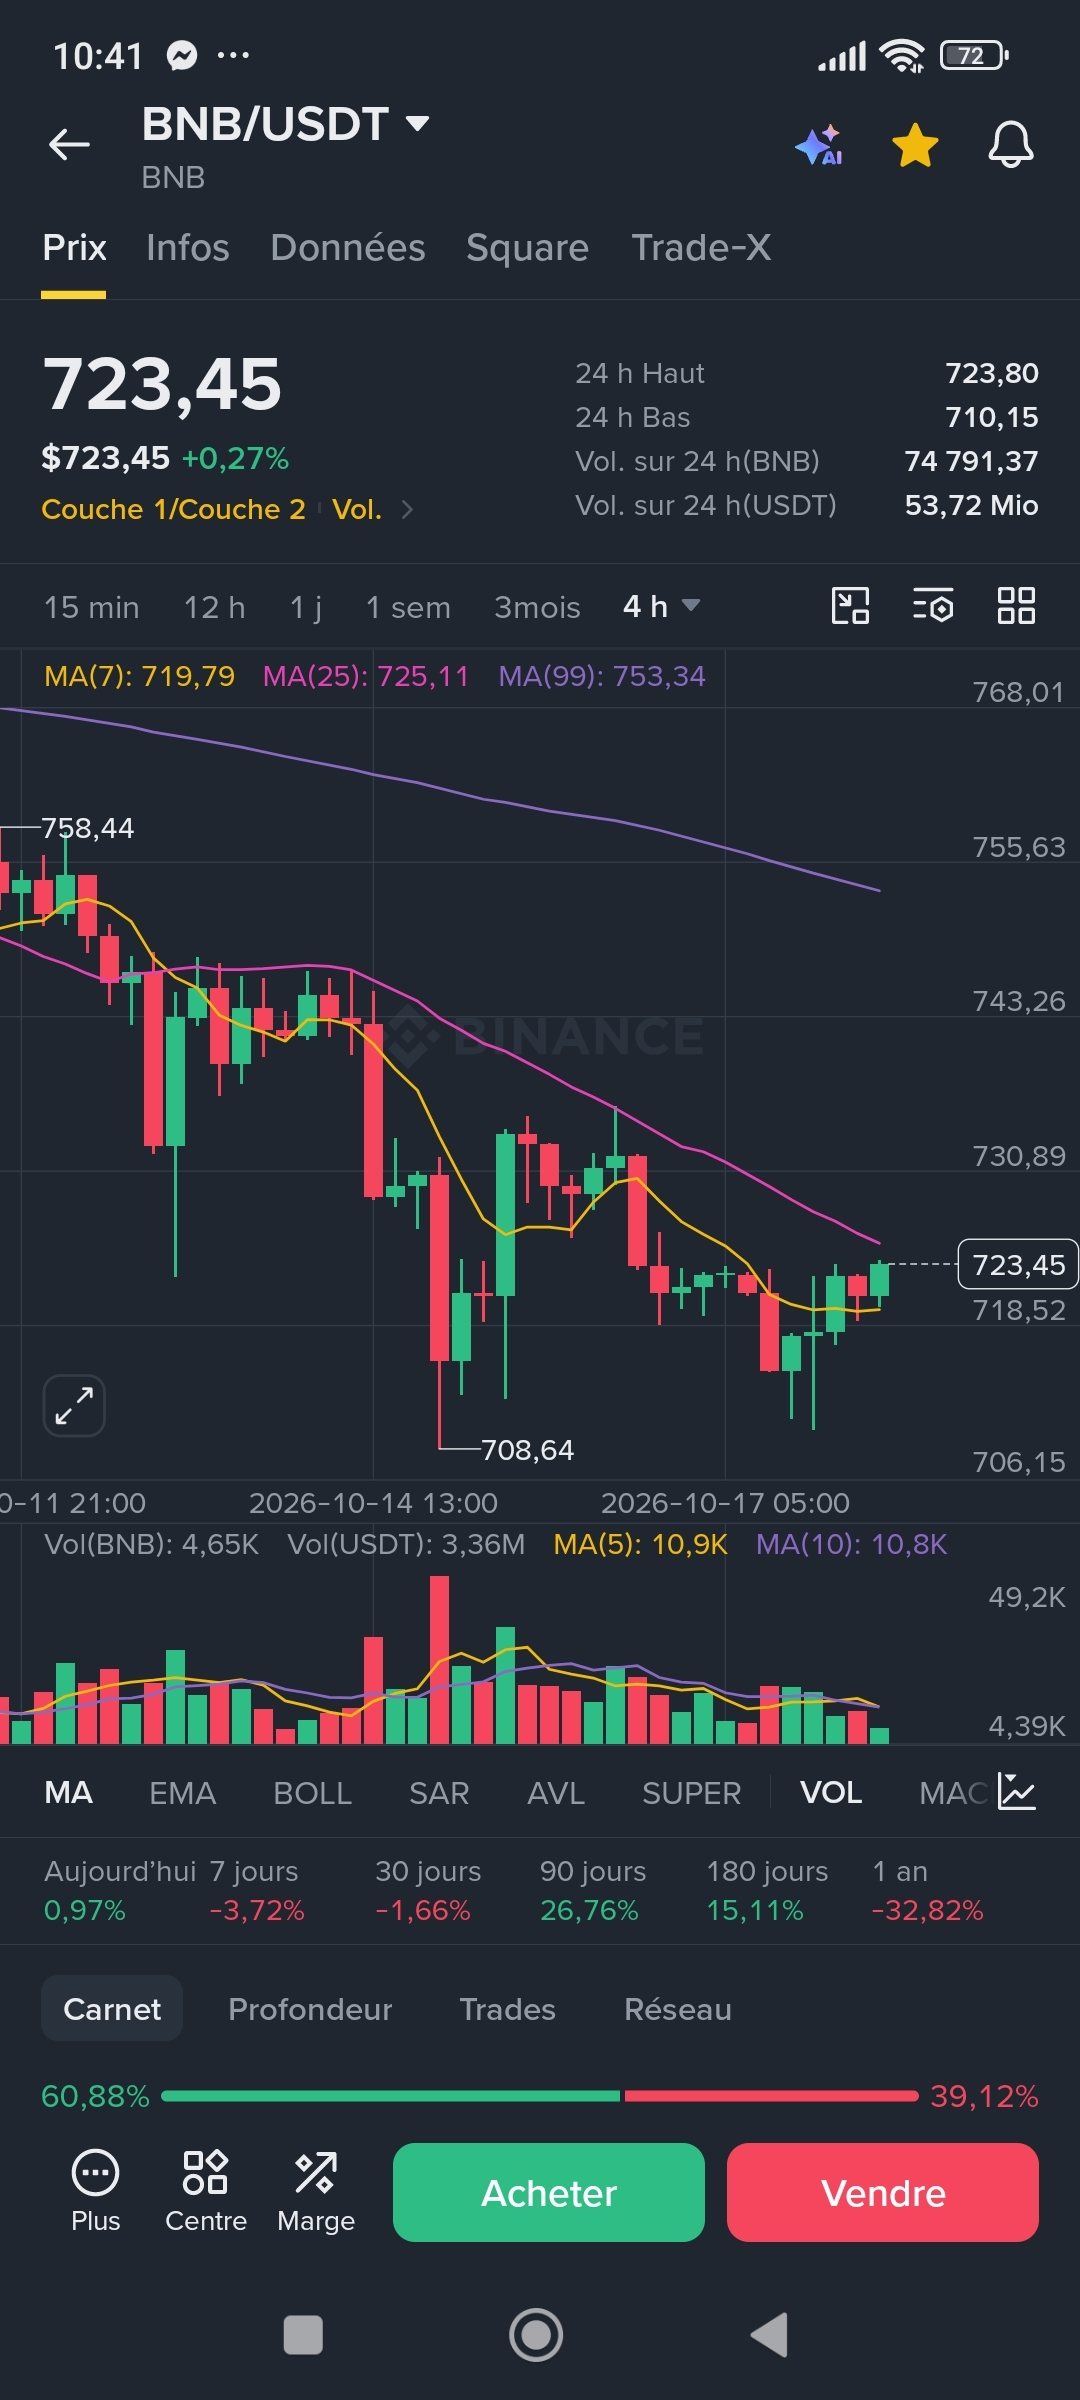
• 4H: the drop from 758 to 708 is clear, then the first green candles appear. The price is near support (≈ 708-710), not in the middle of the zone. Nearby resistance: ≈ 725-735 (pink line), then ≈ 753 (purple line).
My trade journal entry 2 (10/18/2026)
1. BNBUSDT 4H
2. Daily: bearish in the short term
3. 4H structure: lower highs and lower lows (LH-LL)
4. Zone: testing support (≈ 708-710)
5. Signal candle: small green candles, no confirmation yet
6. DXY: to be filled in later
7. Hypothetical entry 724, stop 706, target 750
8. Risk/reward: 18 at risk for 26 potential profit, or ≈ 1:1.4 (below 1:2)
9. Hypothetical risk: 1%
10. Decision: Wait
11. Result: no entry
12. Main mistake: unconfirmed signal + insufficient risk/reward ratio
“Wait” ≠ “Skip.” “Skip” means there’s nothing to do. “Wait” means the trade could become valid if a condition is met, for example, a 4H candle that closes clearly above ≈ 730 while support holds.
This is not a prediction or advice, just a chart-reading exercise.
The difference from ETH: ETH was hesitating in the middle of its zone, so the decision was “Skip.” BNB is near support with the start of a rebound: it could become interesting, but the rebound isn’t confirmed yet.
CONCLUSION
This is not a prediction or advice, just a chart-reading exercise.
**1️⃣ ETH/USDT, 4H: SKIP**
- Daily: bearish in the short term
- 4H structure: overlapping candles
- Zone: middle of the zone (support ≈ 2 318, resistance ≈ 2 540)
- Hypothetical entry 2 430 / stop 2 310 / target 2 550
- Risk/reward: 1:1, less than the 1:2 target
Main mistake: entering in the middle of the zone + insufficient risk/reward ratio
- Decision: **Skip**, because there’s no good trade here
**2️⃣ BNB/USDT, 4H: WAIT**
- Daily: bearish in the short term
- 4H structure: lower highs and lower lows
- Zone: near support (≈ 708-710)
- Hypothetical entry 724 / stop 706 / target 750
- Risk/reward: ≈ 1:1.4, so it’s insufficient
Main mistake: unconfirmed signal + insufficient risk/reward ratio
- Decision: **Wait** for a 4H candle to close above ≈ 730
What I’m learning:
- “Skip” and “Wait” count as trades too.
- I record my decision **before** seeing the result, and never change it afterward.
- A good trade requires a zone, confirmation, and a risk/reward ratio of at least 1:2.
🔁 Tomorrow: I’ll check what happened with $ETH and $BNB.
💬 Do you record only your prices, or also the reasons behind your decisions?
#trading #Simulation #ETH #BNB #education
*Educational content, simulation only. Trading involves the risk of loss.*