

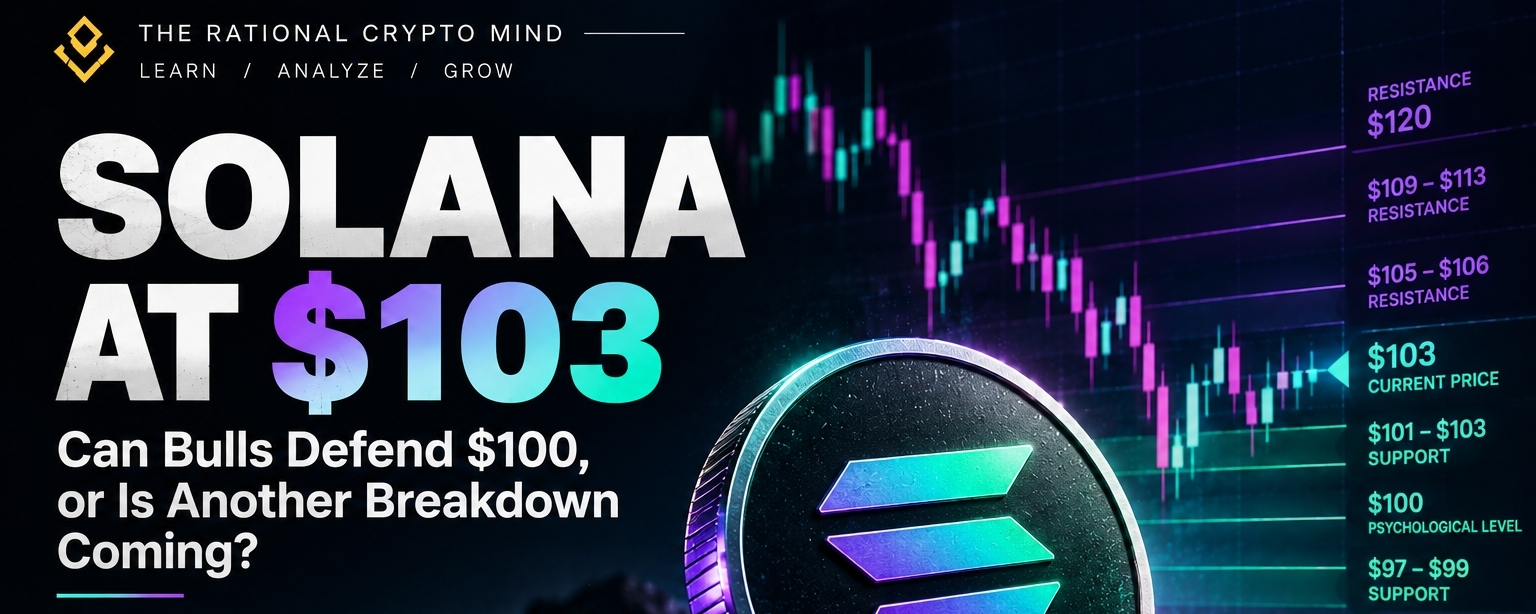

As of October 18, recent market data placed Solana $SOL near $103.84, down approximately 0.52% over 24 hours. The market is showing signs of short-term weakness, with derivatives activity and reported ETF outflows adding pressure to an already cautious technical picture. <Cite refs={["turn610168search0"]}/>
But one question matters more than a small daily percentage change:
Can SOL hold above $100 and build a recovery, or will support give way?
Let's examine the technical structure, market sentiment, and scenarios worth watching.
1. The Current Market Structure
Solana's recent price action suggests that the recovery from its October lows has struggled to develop into a sustained upward trend.
Three factors stand out:
- Weak short-term momentum: SOL remains under pressure after retreating from higher levels.
- A key psychological level: The $100 area has become an important reference point for market participants.
- Uncertain participation: Derivatives activity suggests traders are adjusting their positions rather than showing clear confidence in a sustained recovery. <Cite refs={["turn610168search0","turn610168search2"]}/>
This does not automatically mean that SOL must fall further. It means the market needs stronger evidence before a bullish reversal can be established.
2. Key SOL Support and Resistance Levels
Based on recent reports, these are the main reference zones to monitor. They are not verified live prices and may change as new candles form.
Support zones
- $101–$103: The immediate area around recent price action and the reported $101.37 swing low.
- $100: The major psychological level that has recently attracted attention.
- $97–$99: A lower support zone identified in recent technical analysis. <Cite refs={["turn610168search0","turn610168search2","turn610168search1"]}/>
Resistance zones
- $105–$106: The first area SOL needs to reclaim to show signs of stabilization.
- $109–$113: A potential resistance region where short-term moving averages may create selling pressure.
- Around $120: A broader resistance reference from recent technical analysis. <Cite refs={["turn610168search0","turn610168news6","turn610168search1"]}/>
These levels should be treated as zones, not exact boundaries. A temporary move above resistance does not confirm a breakout, and a brief move below support does not necessarily confirm a breakdown.
3. The Bullish Scenario: Can $SOL Reclaim $106?
For the recovery case to strengthen, Solana needs to hold its nearby support and reclaim the $105–$106 area.
A more convincing improvement would include:
- Price holding above recent lows.
- A sustained move above nearby resistance.
- Increasing trading volume during the recovery.
- A sequence of higher lows on the short-term chart.
If momentum improves, the $109–$113 region could become the next important test.
However, a bounce is not the same as a trend reversal. If SOL rises briefly and then loses the reclaimed level, the market may remain trapped in its current range.
4. The Bearish Scenario: What If $100 Fails?
The bearish scenario becomes more relevant if SOL loses the $100 level and cannot recover it.
A sustained move below recent lows could shift attention toward the $97–$99 zone. If that area also fails, the technical picture would weaken further.
Recent reporting has identified the $100 level as an important point for Solana's short-term structure. <Cite refs={["turn610168search0","turn610168search2"]}/>
Still, a breakdown needs confirmation. Markets sometimes move below widely watched levels before recovering, so the reaction after a break matters as much as the initial move.
5. Derivatives and ETF Flows: Why Sentiment Matters
Price charts show what the market is doing. Derivatives and fund-flow data can offer clues about the forces behind that movement.
A recent CoinMarketCap analysis reported falling open interest, negative funding, and approximately $10.7 million in liquidations on October 17, with most of those liquidations affecting long positions. The report also cited continued outflows from US spot Solana ETFs. <Cite refs={["turn610168search0"]}/>
What does this mean?
Derivatives: Falling open interest can indicate that positions are being closed. Negative funding suggests bearish positioning in perpetual futures, but it does not guarantee that prices will continue falling.
ETF flows: Persistent outflows may indicate weaker demand through those investment products. However, they are only one part of the wider market picture.
Market sentiment: If selling pressure eases while SOL holds support, the environment could become more favorable for stabilization. If pressure continues, recovery attempts may remain fragile.
These indicators provide context, not certainty.
6. Solana's Network Is Bigger Than Its Price Chart
Solana's longer-term story also depends on its blockchain ecosystem: network usage, application activity, transaction demand, developer progress, and the reliability of the network.
A weak price chart does not automatically mean the ecosystem is deteriorating. Likewise, an active ecosystem does not guarantee that the token's price will rise.
The key is to separate two questions:
- Is the Solana network being used and developed?
- Is the market currently valuing SOL more or less favorably?
Both matter, but they measure different things.
Final Verdict: Solana Needs Confirmation
Solana's short-term outlook remains cautious, with $100 serving as the key psychological support reference.
- Recovery scenario: $SOL stabilizes above support and reclaims $105–$106 with sustained participation.
- Weakness scenario: SOL breaks below $100 and struggles to recover, putting the $97–$99 zone in focus.
- Sideways scenario: SOL continues consolidating while buyers and sellers wait for stronger evidence.
The market has not provided enough confirmation to treat either outcome as certain.
The next meaningful signal will come from how SOL behaves around support, whether resistance can be reclaimed, and whether trading activity confirms the move.
Let's discuss: Is Solana showing temporary weakness before a recovery, or is the $100 level at risk of breaking? What evidence would change your view?
— The Rational Crypto Mind | Learn. Analyze. Grow.
Disclaimer: This article is for educational and informational purposes only, not financial advice. Price and technical levels are based on recent published reports and may have changed. Cryptocurrency markets are volatile, and technical scenarios are uncertain.
#Solana #SOL #CryptoAnalysis #Altcoins #Solana #SOL #CryptoAnalysis #Altcoins #TheRationalCryptoMind
