

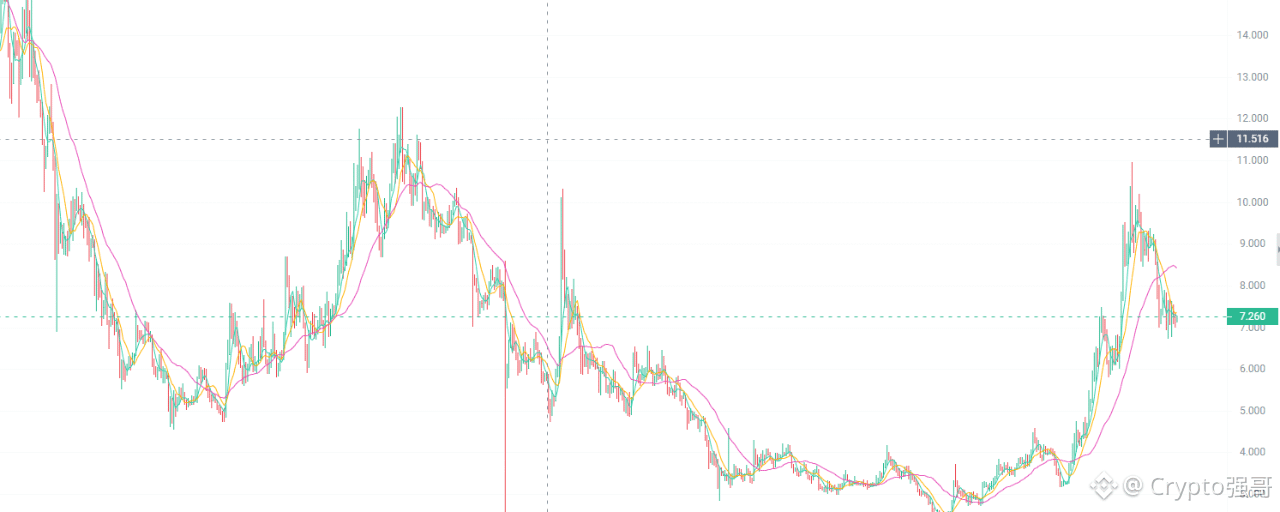

$UNI The current price is $7.260. Today’s trading strategy will focus on cautiously testing long positions in the short term. But what really determines whether a long position can gain momentum is not a subjective guess about price direction; it’s whether the price can hold support, break through resistance, and attract volume at key levels. Today, we’ll analyze the market across three time frames—1-hour, 4-hour, and daily—and set clear entry, stop-loss, and take-profit plans.
I. 1-hour chart: Short-term rebound; watch whether buying pressure can persist
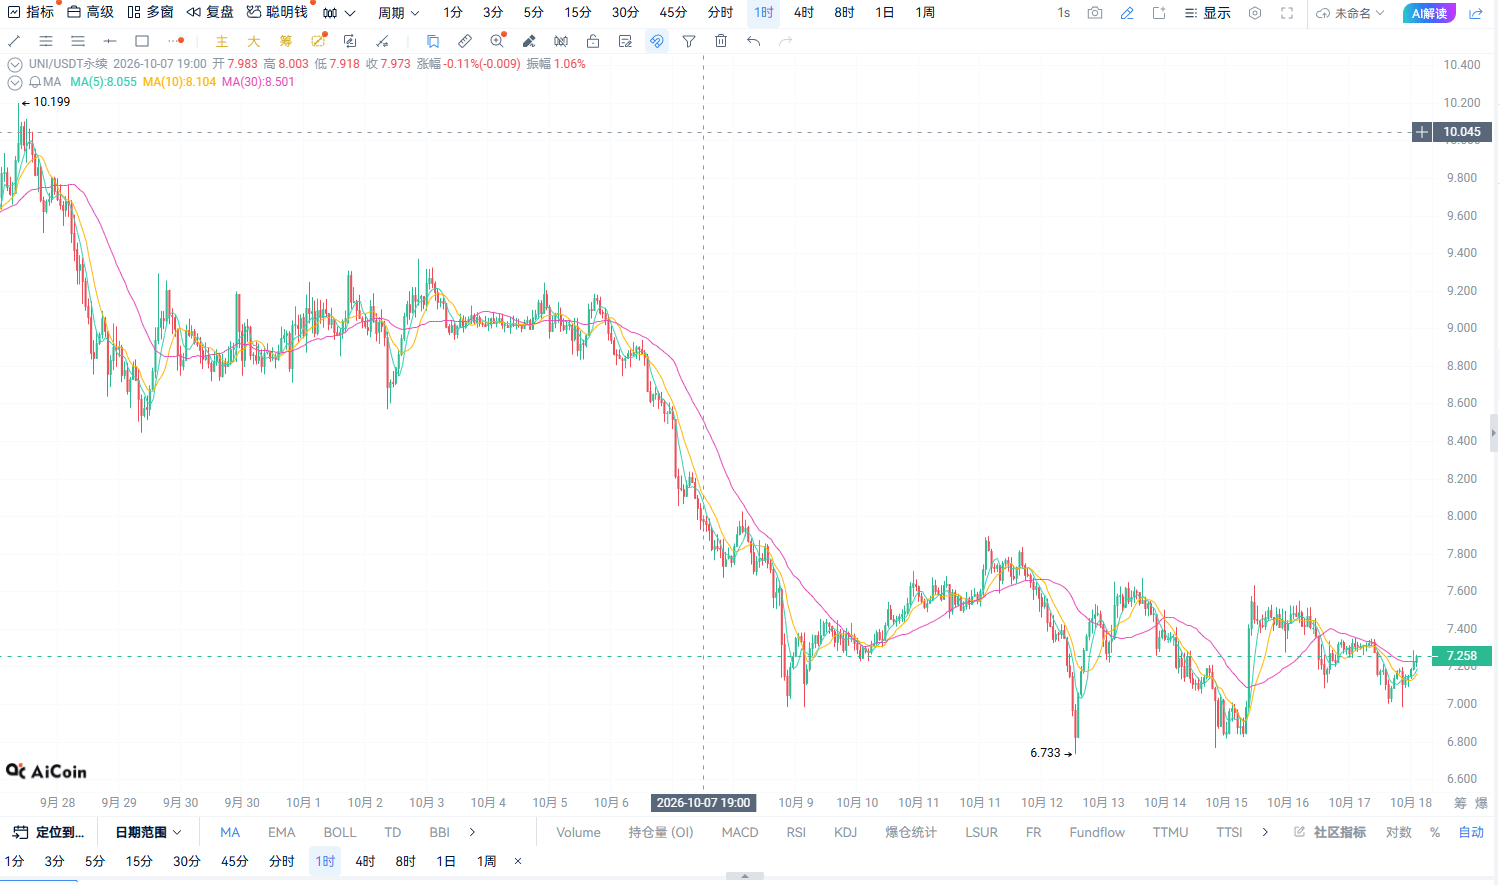
The 1-hour chart is mainly used to assess the pace of short-term capital inflows and outflows. UNI is currently trading at $7.260. In the short term, the first area to watch is support at $7.20–$7.23. If the price retests this area and stabilizes, with signals such as consecutive bullish candles and rising trading volume, it may indicate strengthening short-term buying pressure, giving bulls a chance to push the price toward $7.33–$7.38.
Conversely, if trading volume continues to decline as the price rebounds, or if the price falls below $7.20 and fails to quickly recover, be alert to insufficient bullish momentum and avoid repeatedly adding to your position during a downturn.
Short-term strategy: Watch for support to hold and for confirmed breakouts; don't chase prices blindly. If the price continues to weaken, prioritize following your stop-loss rules.
II. 4-hour chart: Determining whether the rebound will continue or fade quickly
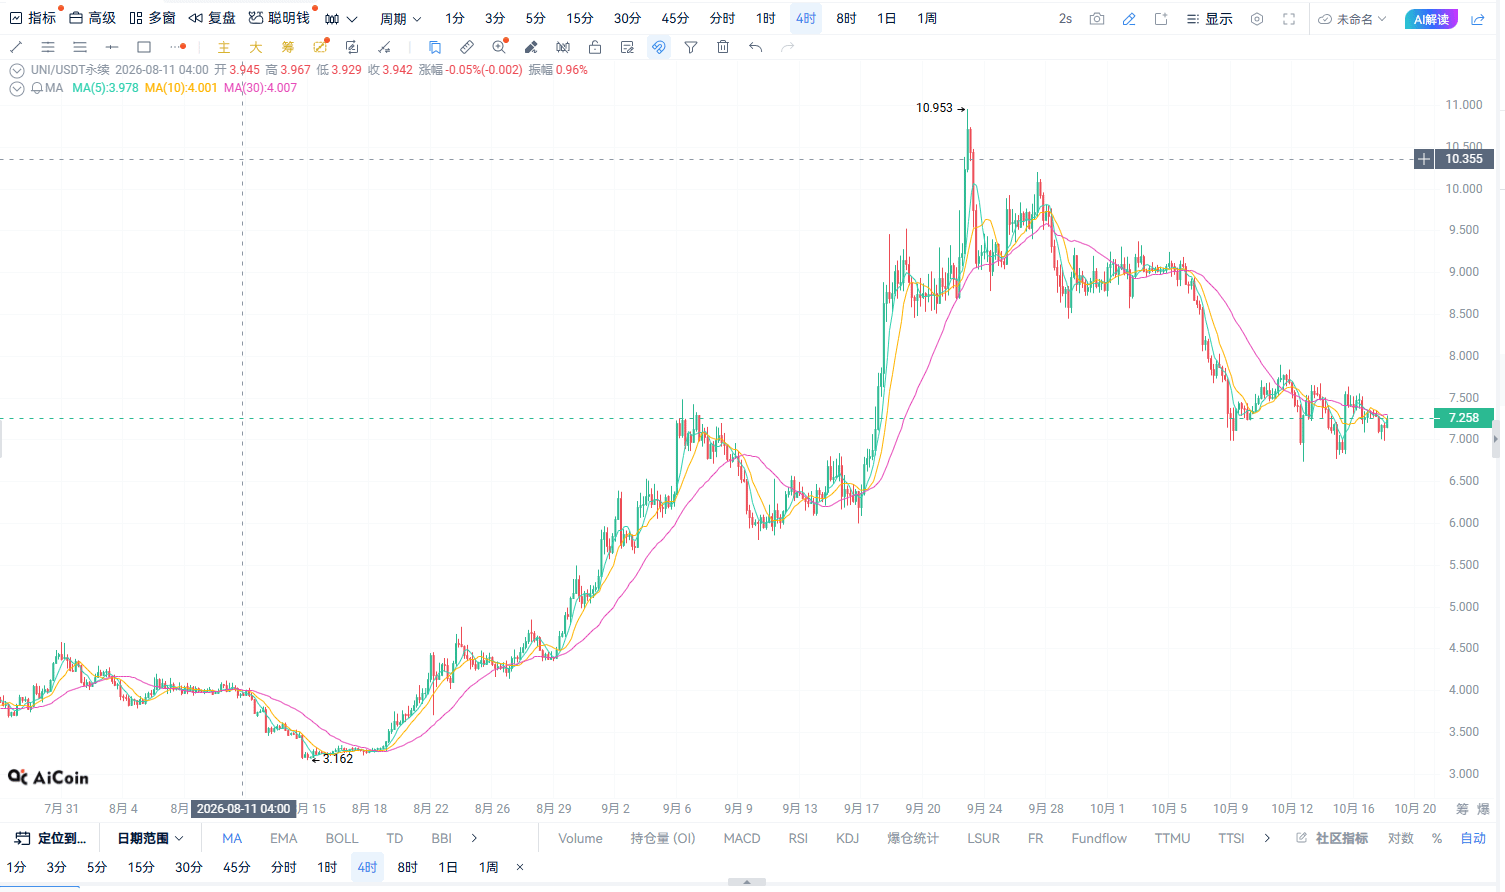
The 4-hour chart is an important timeframe for assessing today's trading structure. If UNI forms a higher low in the support zone and decisively breaks above the previous local high, it may indicate that buyers are gradually gaining control, with the price potentially continuing higher to test resistance near $7.40.
However, if the price fails to break through the resistance zone after multiple attempts, while the lows continue to move lower, the market may still be in a weak consolidation or downtrend. Even if the 1-hour chart shows a rebound, don't be too quick to conclude that the trend has reversed.
Medium-term strategy: Focus on whether the breakout is valid and whether support holds on a pullback. Before the structure is confirmed, testing the waters with a small position is preferable to making a large bet.
III. Daily chart: Determining whether UNI has room to rise further
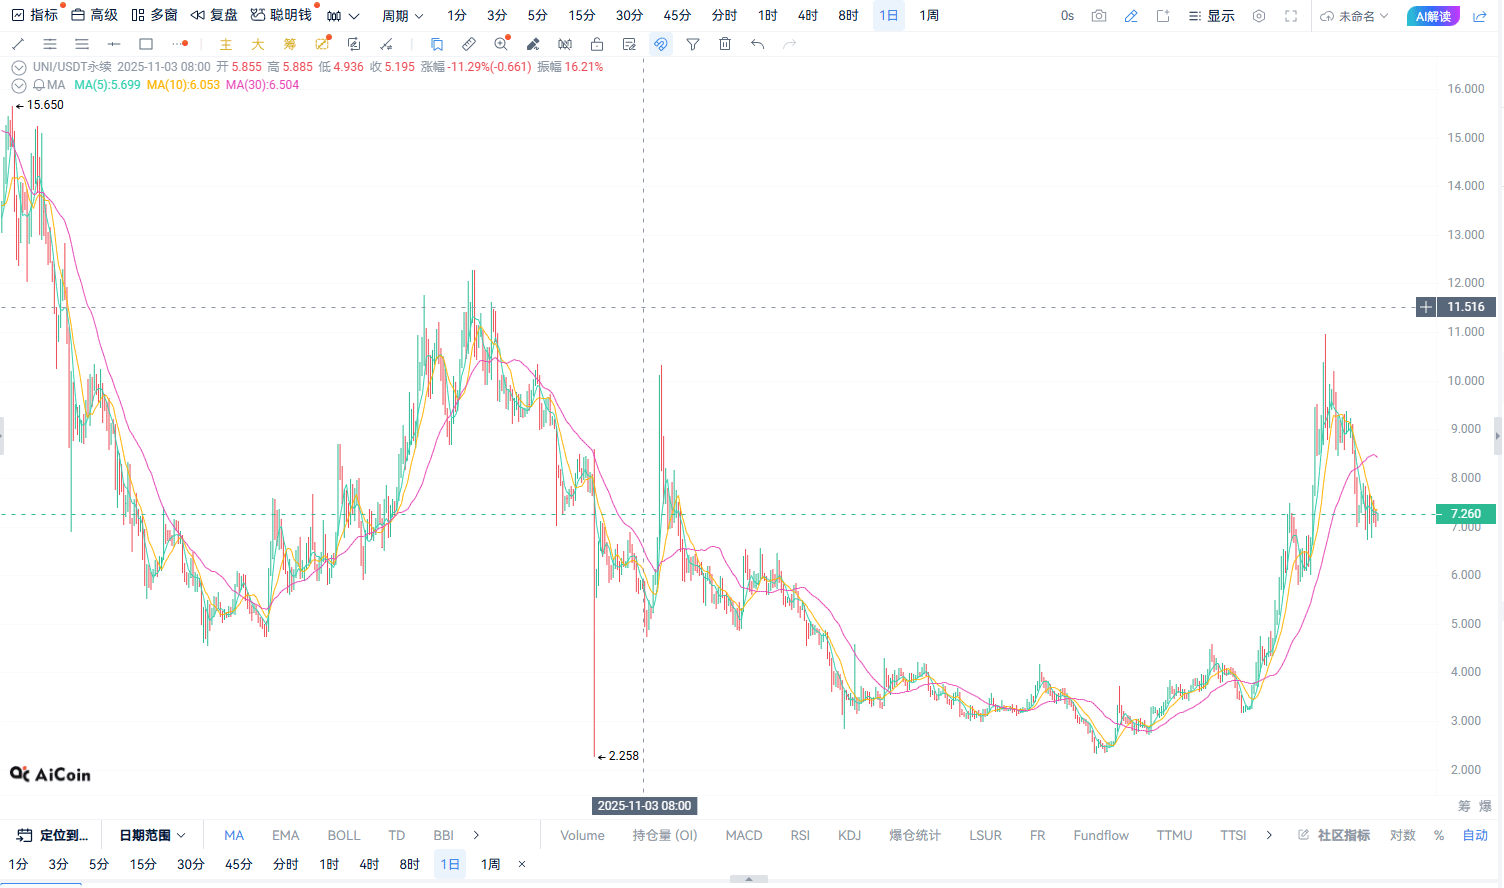
The daily chart determines whether today's long position is better suited to short-term trading or can be held longer. If UNI can steadily reclaim key resistance on the daily chart, accompanied by improving trading volume, market sentiment may gradually recover, creating an opportunity for a larger rebound later.
If the daily chart remains capped by resistance and the price rebounds without breaking above the previous high, the rise is more likely to be a short-term recovery than a clear trend reversal. In that case, prioritize taking short-term profits and avoid becoming overly optimistic based on just a few bullish candles.
Daily strategy: Monitor the trend structure and key highs and lows. Until the daily chart confirms a stronger trend, manage the holding period and position risk for short-term long trades.
IV. UNI trading plan for today
Today's bias is toward short-term longs. Focus on whether the $7.20–$7.23 area can provide support and whether the price can test the $7.33–$7.40 area.
It is important to note that only the current price of $7.260 has been provided; complete candlestick charts, moving averages, MACD, RSI, and trading volume data are unavailable. Therefore, the support and resistance levels above are reference zones to watch, not verified real-time technical signals. If the actual candlestick structure does not match expectations, follow the price action and don't ignore risk just to maintain a bullish outlook.
Remember: Use the 1-hour chart to find the rhythm, the 4-hour chart to assess the structure, and the daily chart to determine the direction. Coordinating these three timeframes helps keep your trading plan disciplined.
V. Real-time trade|UNI/USDT
Trade direction: Long (LONG)
Entry at current price: 7.260
Stop-loss price: 7.151
First take-profit: 7.333
Second take-profit: 7.405
Execution plan: Try a long position at the current price with a small size. Consider taking partial profits at the first target and watch the second target with the remaining position. If the stop-loss level is reached, exit strictly and do not let the loss grow.