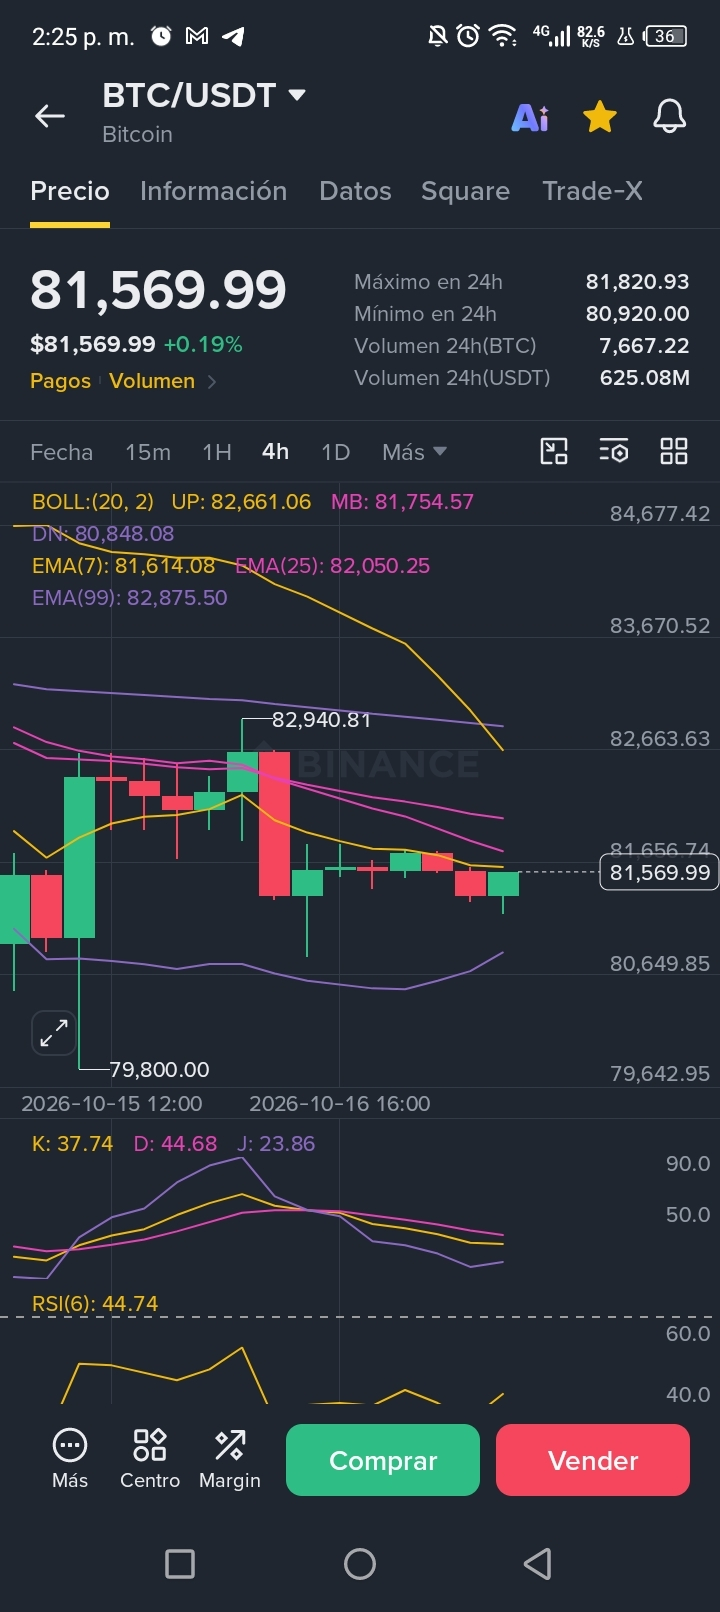

1. THEORY: In trading, a sideways range (or consolidation) is simply a period of time when the price of a cryptocurrency neither rises sharply nor falls sharply, but moves “sideways,” as if bouncing around inside a corridor or a box.
To understand it very simply, imagine a ball bouncing around inside a room:
1.1 The Ceiling (Resistance): This is the highest level where the ball hits and falls back down because sellers are saying, “The price has gone as high as it’s going to go; I won’t pay more.”
1.2 The Floor (Support): This is the lowest level where the price hits and bounces back up because buyers say, "This is cheap—I’m going to buy."
WHY DOES THIS HAPPEN ON WEEKENDS?
Big investors (banks, investment funds, and institutions) don’t trade on Saturdays and Sundays. With less money moving through the market (lower volume), the price doesn’t have enough energy to break through that "ceiling" or "floor."
THE "FALSE BREAKOUT" TRAP (Liquidity Sweep):
Because volume is low, a medium-sized order can suddenly come in and make it look like the price is about to break through the ceiling and shoot to the moon (or break through the floor and fall into the abyss). Many beginners see a large green candle and buy out of fear of missing out (FOMO).
But since no major institutional buyers are backing the move, the price quickly returns to the middle of the range. A "false breakout" happens when the market just pokes its head out of the range to hunt for people’s orders, trigger their stop losses, and immediately move back inside.
2. PRACTICAL LESSON:
See how this rule looks on the 4-hour (4H) Bitcoin chart ($BTC )
IDENTIFY THE RANGE: The price is trading at $81,569.99 (+0.19%), directly testing the dynamic resistance of the EMA 7 at $81,614.08. The nearby ceiling is defined by the Bollinger Middle Band ($81,754.57) and the EMA 25 ($82,050.25).
SUPPORT STRUCTURE: Below, immediate support is at the Bollinger Lower Band at $80,848.08, with the range low at $80,920.00.
WEEKEND RULE: With a neutral RSI reading of 44.74, the key is to avoid guessing breakouts. If the 4H candle doesn’t close with its body above $81,750 or below $80,850 on volume, any sharp move is usually just a wick.
⚡ Analyze the range structure in real time!
👇 Tap the interactive BTC/USDT card below. Open the 4H chart, mark the zone between $80.8K and $81.7K, and assess your entries in one click.

👉 Save this technical lesson to your bookmarks and follow me to keep learning.
💬 Do you usually trade weekend ranges, or do you prefer to wait for the market to open on Sunday night? Let’s talk in the comments!