


Gold has fallen about 27% from its January record of $5,608 an ounce to around $4,112, and silver roughly 54% from $121.62 to about $56. Over the same period central banks bought a record 288.9 tonnes of gold in the second quarter, up 62% year on year, and the silver market is running its sixth consecutive annual supply deficit at 46.3 million ounces. Both of those facts are true at once, and the combination says something specific: on this horizon the physical balance is not what prices these metals.
A Supply Deficit Did Not Stop a 54% Decline
The structural case for silver is straightforward. Six years of deficits, stagnant mine production, and mine development cycles too long to respond quickly to demand.
None of it prevented the price halving.
That is the most useful information in the data. A market where supply falls short of demand every year for six years and the price still falls 54% is a market priced by positioning and macro conditions, not by inventory. The physical shortfall may matter eventually; it did not matter this year.
What Broke Silver Took Four Days
The sequence is documented and it is mechanical rather than fundamental.
Spot silver peaked at $121.64 on January 29, driven by Chinese retail buying, trend-following funds and dollar-debasement narratives. CME had already raised speculative silver margins from 9% to 11% on January 27. On January 30, Kevin Warsh’s nomination as Federal Reserve Chair led markets to price tighter policy and higher real rates, and the dollar rallied.
Silver then fell 26% in a single session to $85. Margins went to 15%, with 16.5% for heightened risk.
The margin structure is the detail worth understanding. Requirements are set as a percentage of price, so they rise as the price rises. A leveraged position that was adequately funded at $80 becomes undercollateralised at $120 without the trader doing anything, and the resulting liquidation is forced regardless of what the physical market looks like.
Warsh, whose Bangkok remarks moved rate expectations again on Friday, was the macro trigger nine months ago.
Industrial Demand Has Already Fallen
The demand picture is weaker than a forward-looking framing suggests.
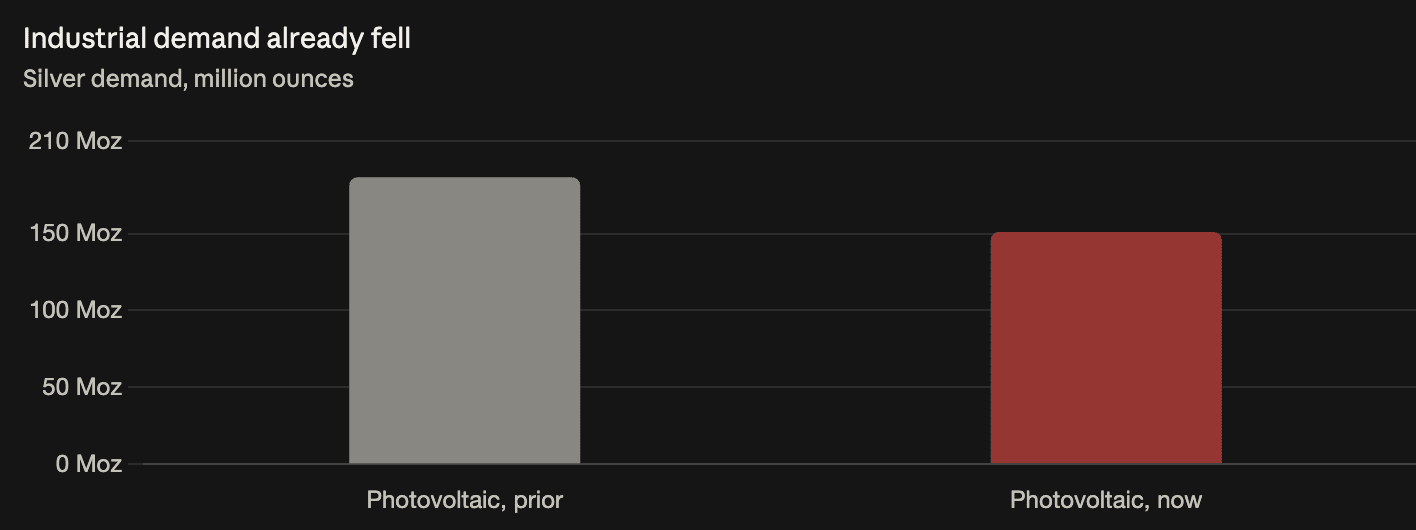
Photovoltaic silver demand fell 19% year on year to 151.0 million ounces from 186.6 million. Total industrial demand fell 3% to 639.6 million ounces. Data centre, electric vehicle and grid-upgrade demand exists, but it did not offset the solar decline — the aggregate still fell.
The cause is the price itself. Above $100 an ounce, solar manufacturers thrifted silver, reducing the quantity used per panel. That is the mechanism that caps any supply-shortage thesis: high prices destroy the industrial demand that generates the deficit, and the adjustment arrives through demand because mine supply cannot move quickly.
The Deficit Is Real but Modest
The 2026 shortfall widened to 46.3 million ounces from 40.3 million, an increase of about 15%.
Set against industrial demand alone of 639.6 million ounces, that deficit is roughly 7%. Against total demand including investment and jewellery it is smaller again. “Sixth consecutive deficit” describes a persistent condition; the magnitude does not describe a scarcity crisis.
Gold’s Case Rests on Different Foundations
Gold’s drawdown of 27% is half silver’s, which is the usual ratio. Silver carries industrial demand on top of its monetary role, so it absorbs both the rate signal and the growth signal, and trades in a thinner market that amplifies both directions.
The gold bull case is also structurally different and more durable. US fiscal deficits, rising federal interest payments and central bank reserve diversification are all long-horizon forces that do not depend on industrial consumption. Jamie Dimon named large fiscal deficits among his five market concerns in JPMorgan’s results this week, and the 288.9-tonne quarterly central bank figure is evidence of the diversification trend rather than a forecast of it.
What those forces do not explain is a 27% nine-month decline. They are reasons to hold gold over a decade, not reasons the price fell this year.
The Drawdown Is Nine Months Old, Not Current
One framing correction worth making. Silver traded around $57.62 at the end of July and sits near $56 now — broadly range-bound in the mid-to-high $50s for three months.
The 54% fall happened in and shortly after January. Describing it as an ongoing slide misreads the tape; the metal has been stable since mid-year, which is itself a relevant data point about where the selling exhausted.