



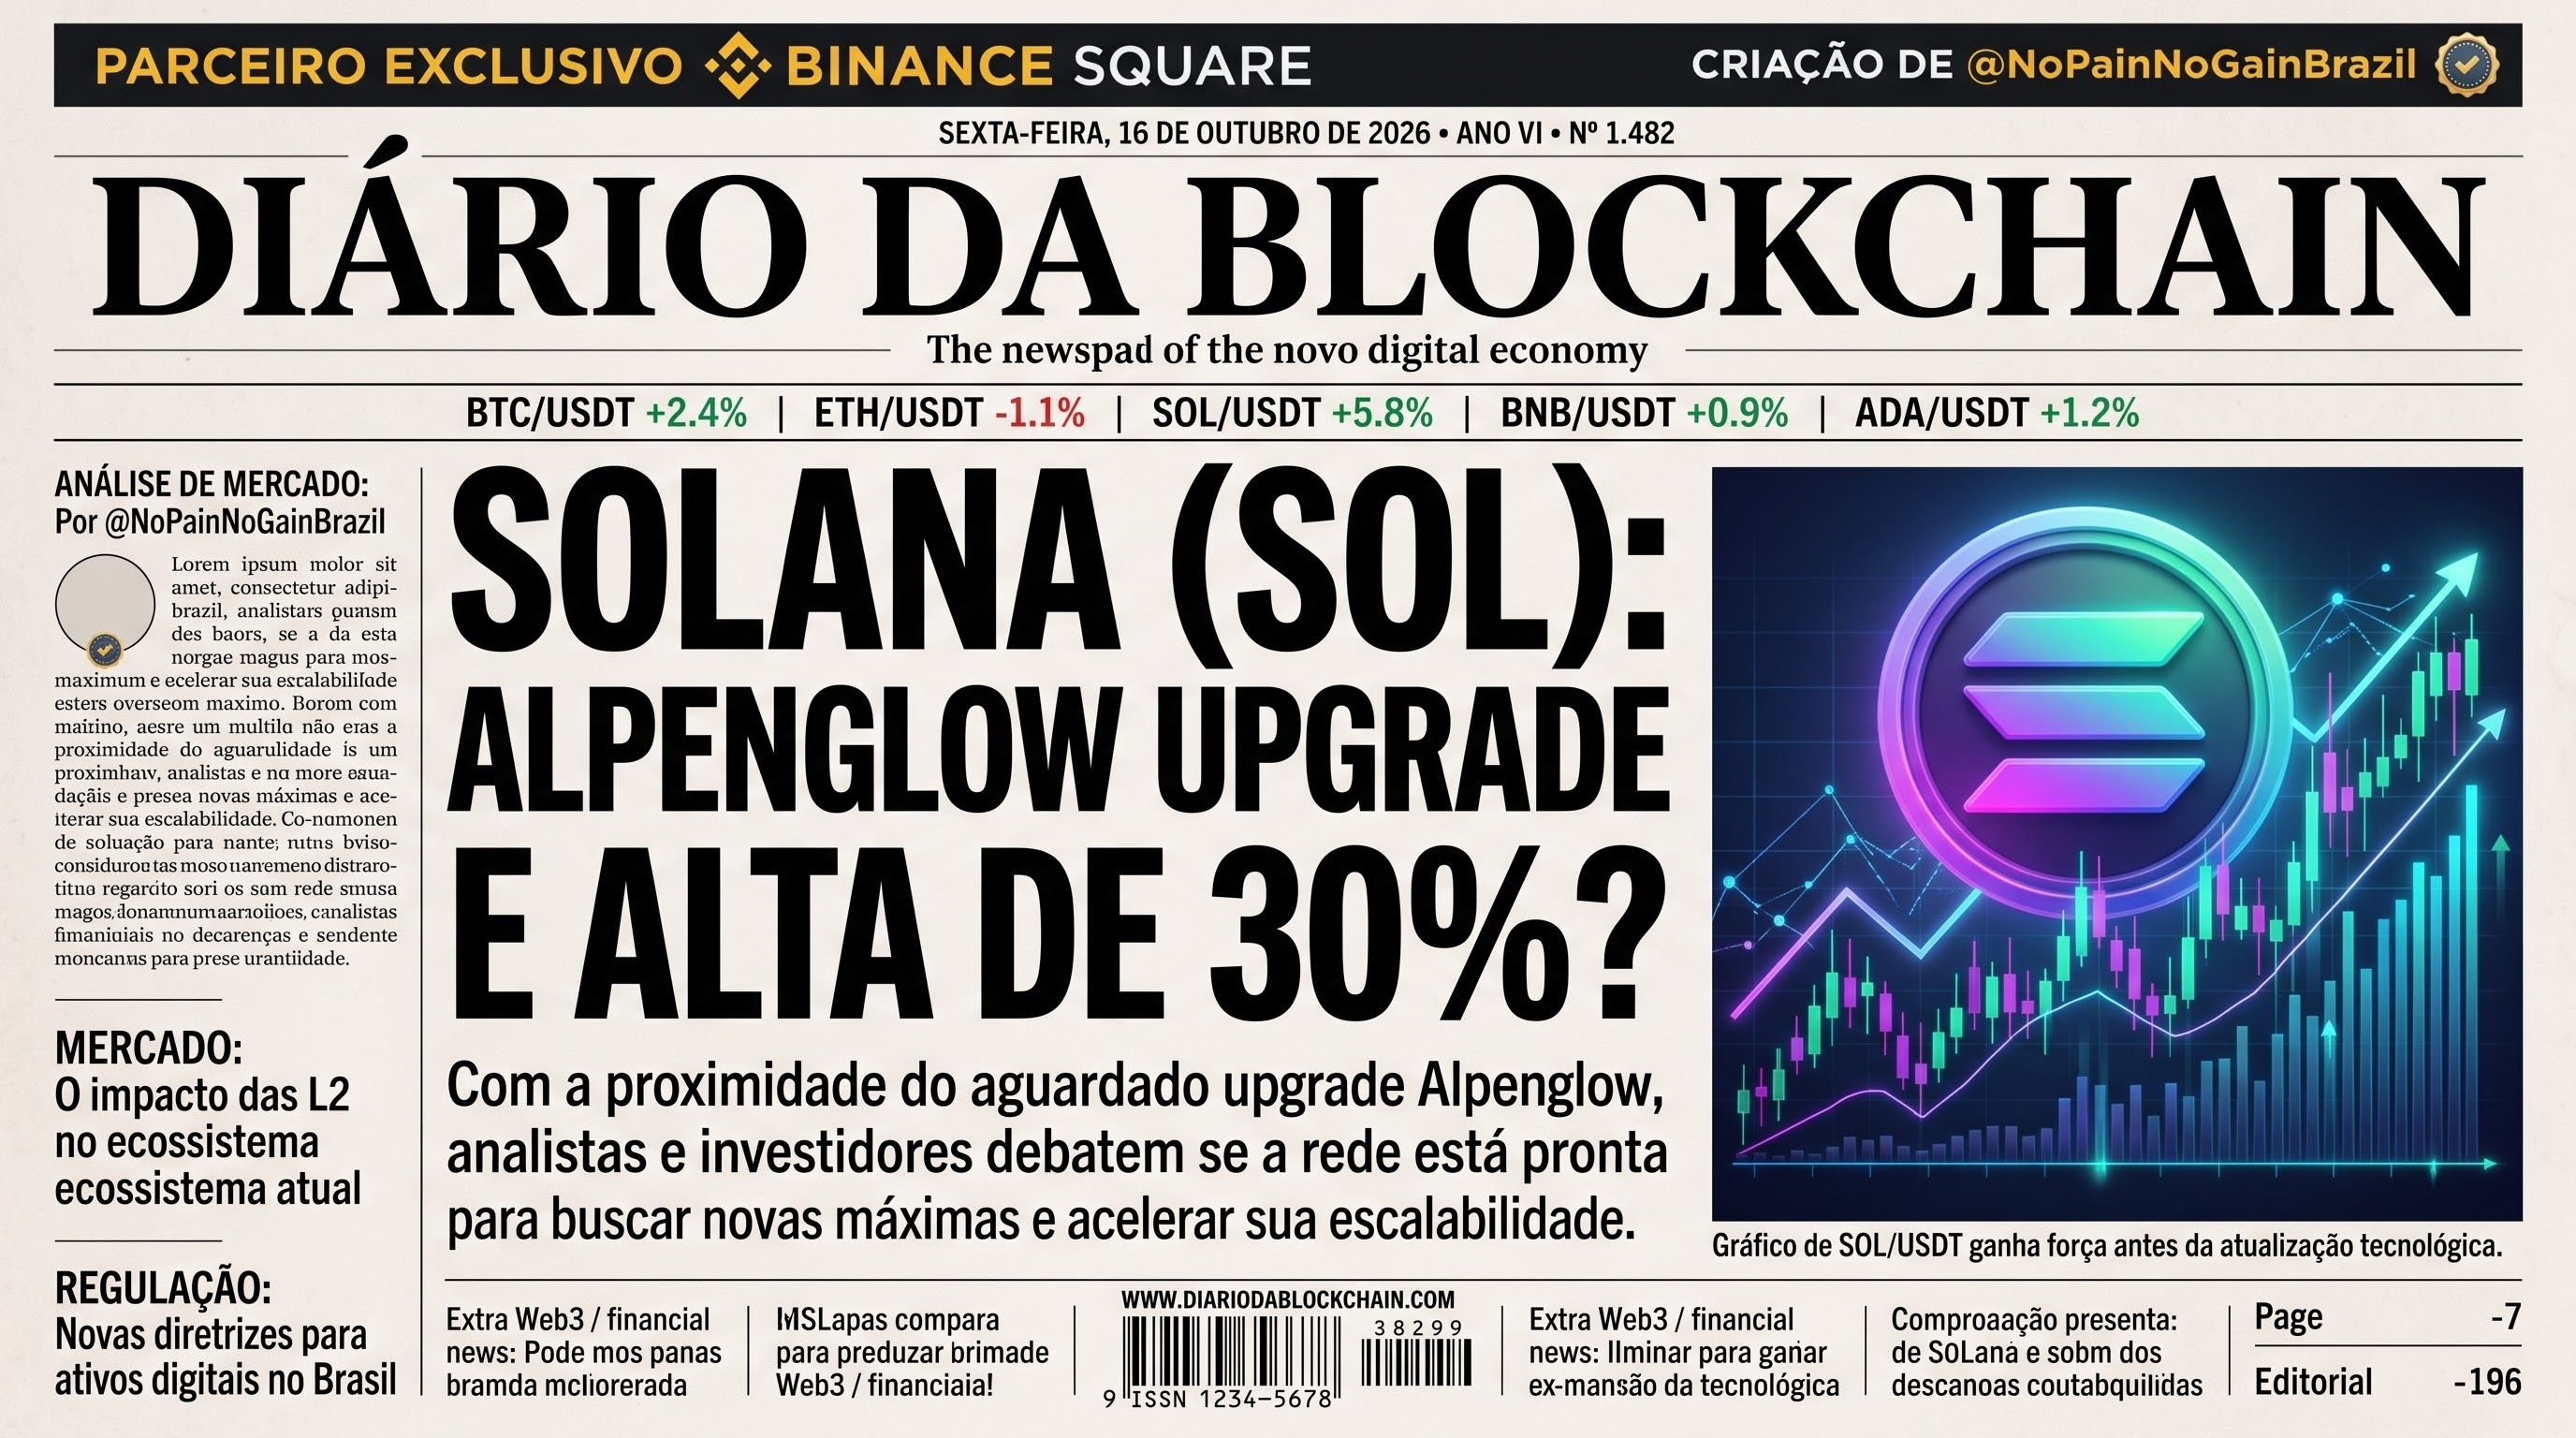
The Solana ($SOL ) ecosystem is about to experience one of its most pivotal moments. As highlighted in Binance’s official feed, the "Solana's Alpenglow Upgrade" is scheduled to go live on October 21, bringing major changes to the network’s consensus efficiency and prompting analysts to forecast gains of up to 30% in the short to medium term.
But what is the price chart telling us today? Let’s head straight to Binance’s trading screen to analyze the asset’s current structure.
🔍 Fundamentals: What Is the Alpenglow Upgrade?
This is not just routine maintenance. The Alpenglow upgrade aims to replace the old consensus mechanism with a new validator that promises to drastically cut finalization times. Faster infrastructure attracts more dApps and more volume, consequently driving organic demand for the SOL token.
📊 Technical Analysis: Interpreting the Chart (Daily Chart - 1D)
Analyzing the SOL/USDT pair (with the asset trading around US$104.73), the market is showing a clear tug-of-war and extreme accumulation:
• Bollinger Bands (BOLL): The price is squeezed against the lower band (DN: 101.46), with the middle band (MB) at 114.07 and the upper band at 126.69. The narrowing bands indicate volatility compression—the famous “spring effect” that precedes a strong breakout.
• Moving Averages (MA and EMA): The current price is trading slightly below the MA(7) at 106.93 and the EMA(7) at 107.08. The bulls’ big challenge now is to reclaim the short-term resistance zone between US$107 and US$110 (where the VWAP at 111.01 is also located).
• RSI (Relative Strength Index): The 6-period RSI is trading around 27.77. Technically, values below 30 signal oversold territory. This shows that the price has fallen too far in the very short term and that sellers are becoming exhausted, opening the door to a relief bounce.
• Bullish Trigger (Technical Target): If the bulls defend the psychological support at US$100 and the upgrade catalyst kicks in, a break above resistance at US$114–US$116 would clear the way to reach the target set by analysts, in the US$135–US$140 range (a projected gain of approximately 30%).
💡 Scenarios to Watch:
1. Bullish Scenario: Holding above US$100, the RSI reversing out of oversold territory, and a positive reaction to the hard fork on October 21.
2. Cautious Scenario (Bearish): If the broader crypto market turns sour and the price closes a daily candle below US$100.62, the accumulation structure will be lost, putting the next significant support around US$94.45 (MA 99).
Note: Remember to manage risk and use appropriate stop orders. Network upgrades often bring high volatility on the day of the event.
What do you think? Will Solana explode after the 21st, or will we see the classic “buy the rumor, sell the news”? Share your thoughts in the comments! 👇