



Separate the basis for taking a position locally from the later confirmation on the larger timeframe
You see the hourly chart starting to rise, then switch to the daily chart, which is still falling. Which one should you trust?
As I read the first comprehensive case study in Chapter 5 of (The Wyckoff Method), I felt one key shift was this: the larger timeframe sets the context, while the smaller timeframe can provide an early basis for taking a position. After entering, you can then check whether the larger timeframe follows through.
First, freeze BTC at 20:00 on February 6, 2026, and set aside what happened afterward.
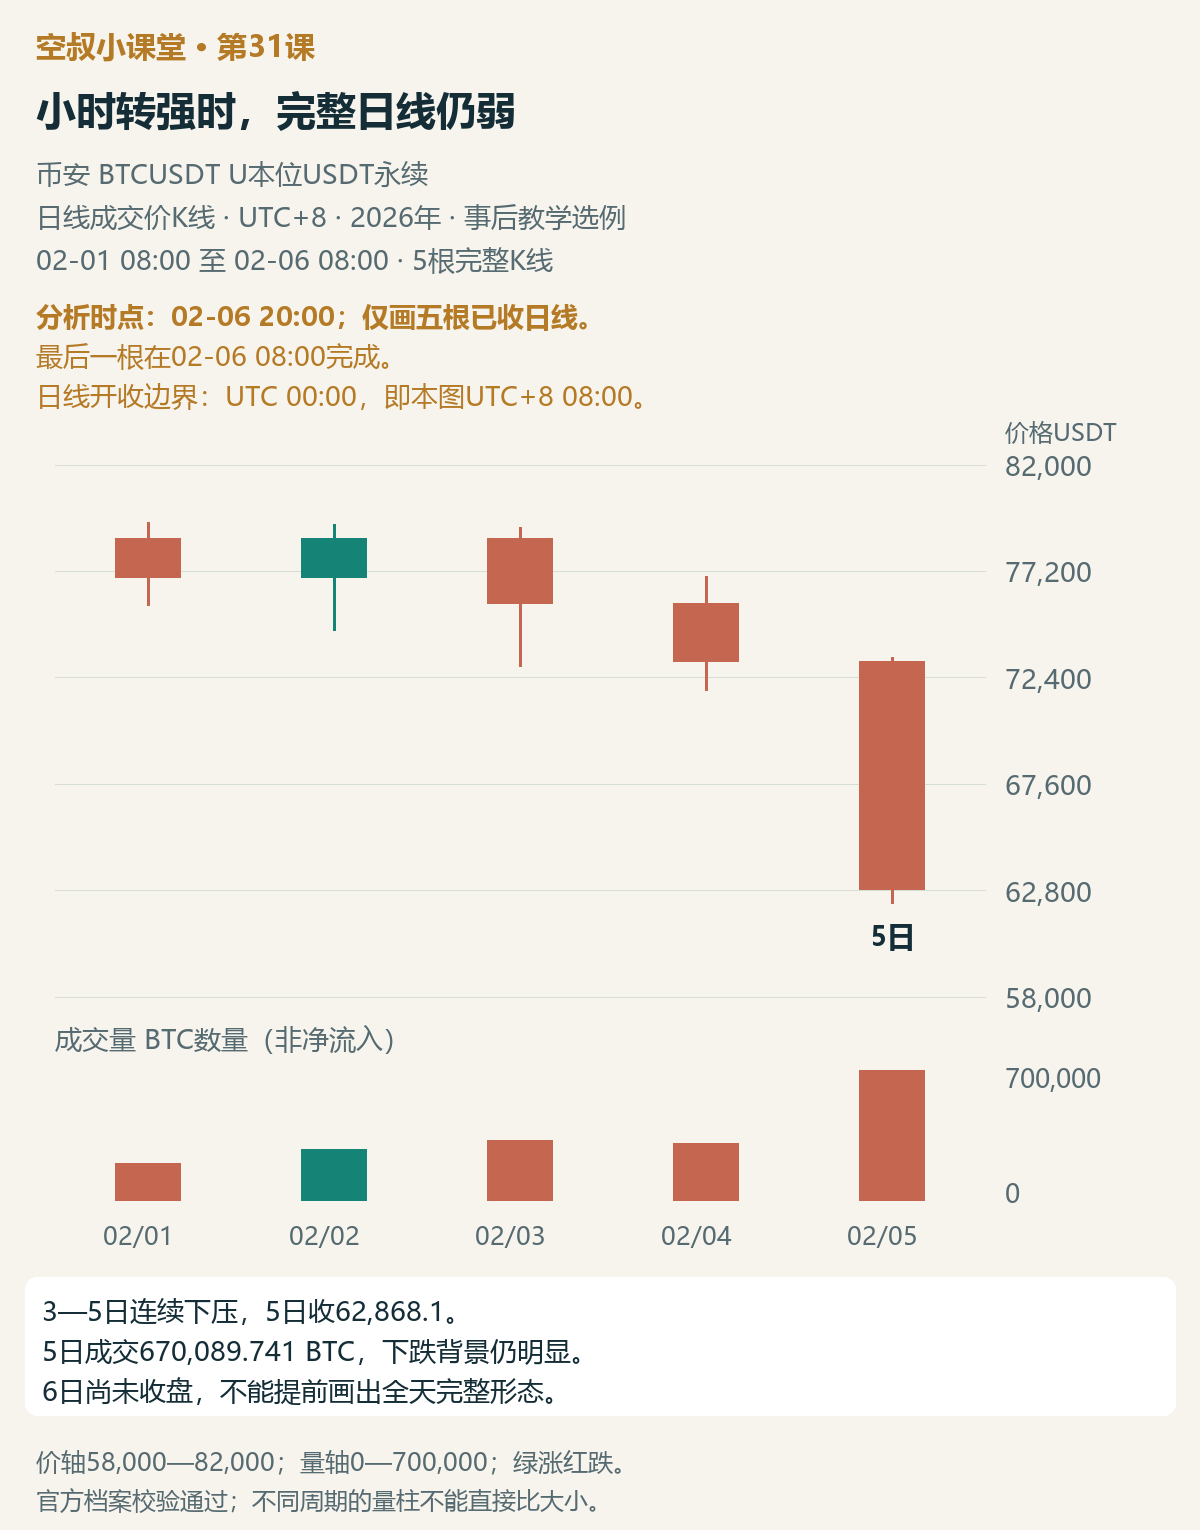
Figure 1 | Analysis point: February 6, 20:00. Shows only the five preceding complete daily candles; the latest one closed at 08:00 that day. The daily chart is still under sustained downward pressure, and the full-day formation for February 6 is not yet known.
On February 3, 4, and 5, the daily chart came under sustained downward pressure, with the last candle closing at 62,868.1 on volume of about 670,000 BTC. The complete daily candles still point to a bearish backdrop, with supply in control. Next, we need to see whether the hourly chart shows a new development strong enough to support a local rebound.
First, let's align the clocks: Binance's daily candles are divided at 00:00 UTC, which corresponds to 08:00 UTC+8 on the chart, when each new candle begins. This article refers to daily candles by their opening date. At 20:00 on February 6, the February 6 daily candle had only been underway for 12 hours; its full-session close and volume were not yet known.
All actual charts use Binance BTCUSDT U-margined USDT perpetual trade-price candlesticks. Prices are in USDT, volume is total BTC traded, and all times are UTC+8. This is a retrospective teaching example.#BTC
What more does the hourly chart tell us?
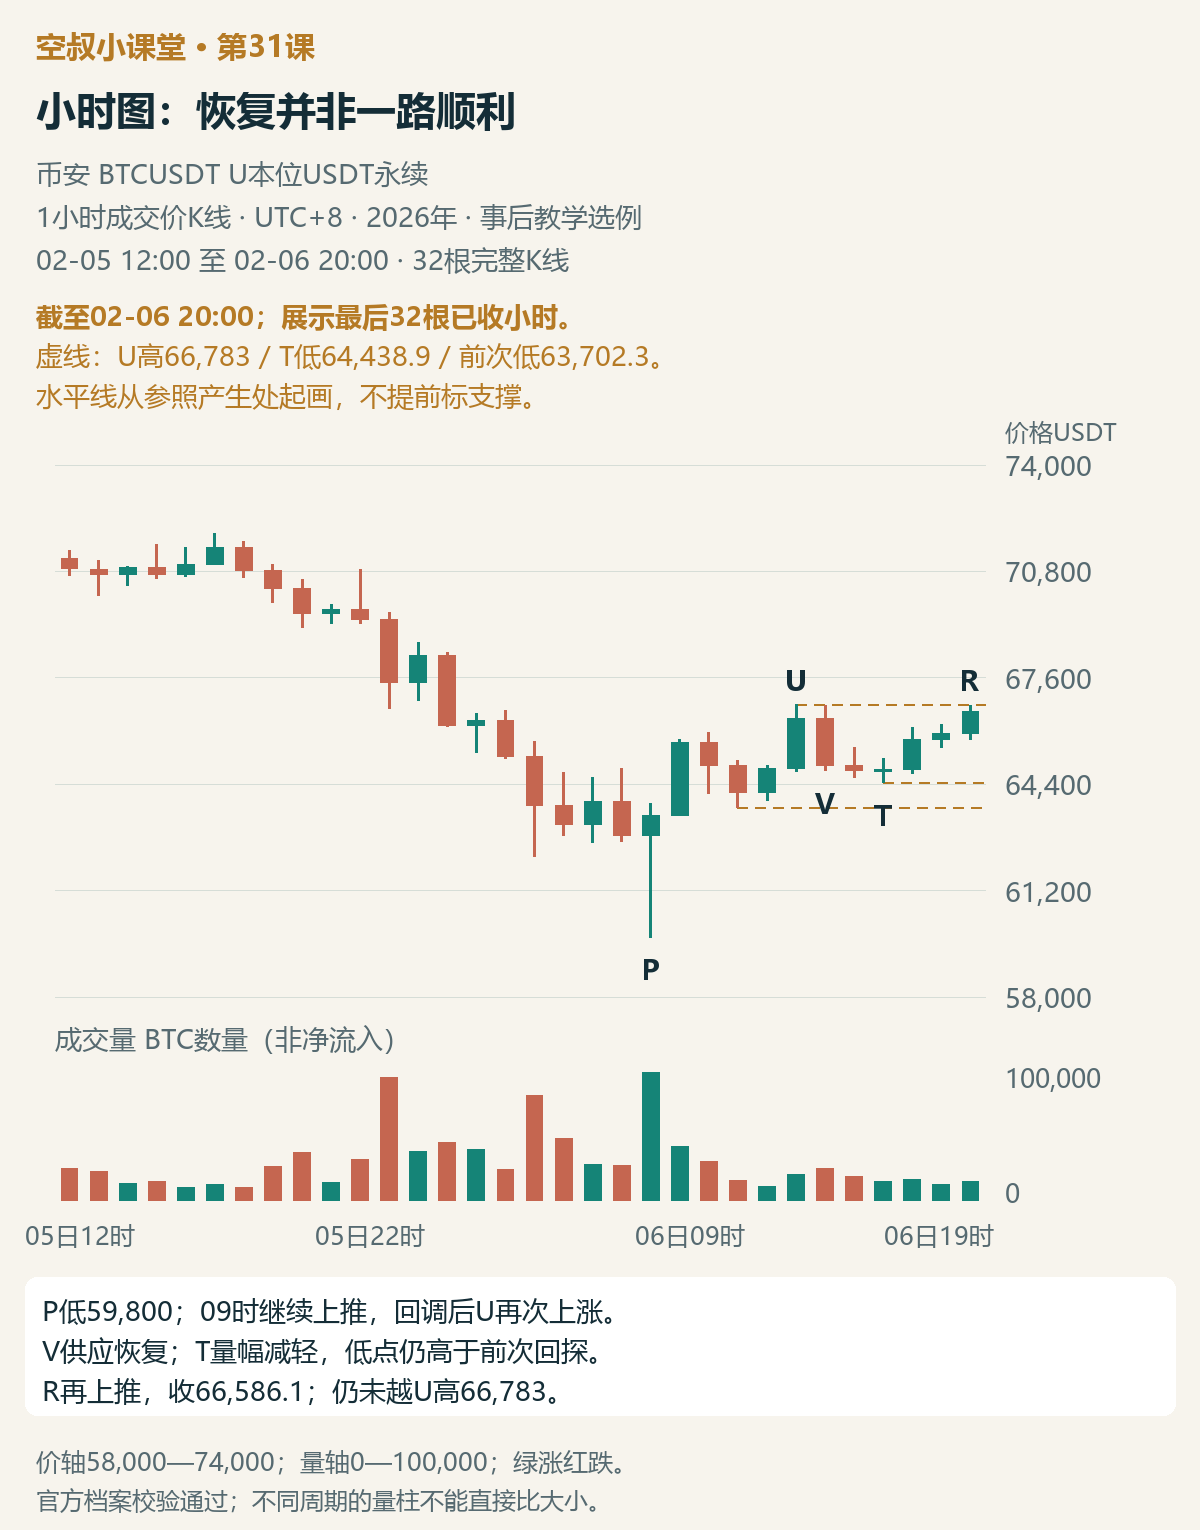
Figure 2 | Also through February 6, 20:00, zoomed in on the last 32 completed hourly candles. After the sharp drop at P, price recovers; U pushes higher again, supply returns at V, price pulls back to T, and then moves up again at R. No subsequent price action is shown.
At P, on February 6 at 08:00, price briefly fell to 59,800, then rebounded; the next hourly candle continued higher. A response from demand is already visible: price not only forms a lower wick but also continues to rise.
During the first pullback, volume on the two hourly candles gradually declined. The low was 63,702.3, holding above the P low. Price then rose again at U, with volume nearly twice that of the previous hour, and the close moved above the closing high of the prior rebound. Demand made further progress.
But V immediately pushed price back down, on volume greater than at U. Supply remains overhead, so we cannot focus only on the two upward moves.
The key comes next: at T, both volume and the high-low range were smaller than at V. The high-low range is simply the candle's high minus its low. Although T dipped slightly below the previous hourly low, its low of 64,438.9 remained above the previous pullback low of 63,702.3.
Price then pushed higher again. R closed at 66,586.1, above U's close, but had not yet exceeded U's high of 66,783.
As of February 6, 20:00, my main view of this move is that hourly demand has recovered, giving the rebound a basis to probe higher. This supports a local long plan. The decisive evidence is that after U pushed higher again and V drove price back down, T showed lighter volume and a smaller range, with a low above the previous pullback; then R closed back above U's close. This time, supply did not erase the earlier recovery.
This view applies to the hourly rebound. The complete daily candles are still under downward pressure, and the current hourly price has not yet broken above U's high. The long plan needs to address nearby resistance and support at the pullback; the daily chart will subsequently test whether demand can expand.
Why does the book allow participation first, with daily-chart confirmation later?
The first example in Chapter 5 covers the S&P futures market in early March 2009. Daily Chart 5-1 is labeled ES and shows a clear bear-channel backdrop. The first five candles starting at A hug the lower channel line, which the author calls an oversold line. B closes higher but is a doji; C continues lower on declining volume. The daily chart does not yet show clear demand-driven progress.
But hourly Chart 5-2 provides a different chain of evidence. Candle 1 surges on increased volume, recovering in one move the decline of the previous five candles. The author first considers short covering—that is, buying by shorts to close their positions—as the cause of the rise. Only after the pullback is slow, with lighter volume and a smaller price range, and the gains are not quickly given back, does the author further interpret it as evidence of demand.
Candle 2 rises again on increased volume, but 3 shows supply returning, and volume also increases during the subsequent decline. Then 4 breaks below the day's low, but volume on the following candles quickly falls. Both pullbacks at 2 and 4 remain above major support. Breaking the day's low is not the same as breaking below support for the entire structure. On this basis, the author considers the bullish view justified.
Candle 1 falls within the hourly period covered by daily candle B; candles 2, 3, and 4 fall within the period covered by C. Daily candle C still looks weak, but zooming in reveals a response from demand and a test on the pullback. That is the value of combining timeframes. The author interprets the test as supply drying up, and in the results section points out that what looks like a V-shaped move on the daily chart shows an accumulation process on the hourly chart.

Figure 3 | Analysis, plan, and outcome from the first example in the book, shown together. Teaching illustration, not actual market data; summarizes the relationship between Charts 5-1, 5-2, and 6-1.
Page 162 presents a plan to participate at the time, with the first target at the supply line of the declining channel—that is, its upper boundary—followed by an expectation of daily-chart follow-through to the upside. The original example places the stop one point below the daily low. Its separate risk-management rule says to exit regardless of profit or loss if the next daily candle falls on increased volume. That “one point” belongs to the original ES example and must not be applied as a universal BTC parameter.
In the outcome covered in Chapter 6, D is where demand appears on the daily chart, providing follow-through that confirms the earlier participation. E then moves further away from the supply zone and breaks through the supply line. The author calls F and G JOC: price moves up through resistance, and the subsequent pullback is weaker than the upward move. The author interprets this as demand being in control.
The hourly chart provides a basis for participation; D confirms expanding demand, and only after E does the broader outlook change further. This sequence is the most important lesson from this example.
Back to BTC: with a basis for action, how do we turn it into a plan?
We are still at the cutoff point shown in Figure 2. Directionally, I lean toward this rebound continuing higher. The plan is to first test whether the U high at 66,783 can be cleared and held, then whether price can advance toward the previous area around 68,667. On the daily chart, I expect the session to close showing a response from demand, followed by a recovery toward and hold above the April 4 daily low near 71,838. All three prices were already available reference points at the time, each serving a different test.
If you are willing to participate based on the hourly structure already in place and can accept the risk defined in advance, you could consider going long on this rebound. A bullish daily close is not a prerequisite for this plan. R closes near the U high, but it is more than 2,000 points away from the T low at 64,438.9. That makes the current entry location unfavorable; it cannot be called a low-risk buy point.
If you are concerned about the nearby resistance, or cannot accept this risk distance, you can wait for the hourly chart to break above 66,783, pull back while holding above it, and then show an upward response. The reasons to wait are the resistance and the risk distance; there is no need to turn that into a rule that everyone must wait for a bullish daily close. If the setup does not appear, do not act. If price rises without you, do not remove the conditions on the fly.
There are clear grounds for invalidating this bullish view. If price falls back below T at 64,438.9, the latest pullback's support has failed. Those waiting should pause the original long plan and must not keep trading on the basis that “T held, so price will continue higher.” If the previous pullback low at 63,702.3 also gives way, the structure of two successively higher pullback lows is broken, further undermining the original basis for a local long.
For those already in a position, once the pre-set stop is triggered, act according to the original conditions. Do not wait for increased volume or for the hourly or daily close. The chart provides structural reference points; the actual trigger and position size should be determined before entry. Do not keep moving the stop lower after price falls, and certainly do not assume you can simply hold on until the P low.
The difference between daily-chart risk management here and in the original example should also be made clear before looking at the outcome. The book's plan for that trade explicitly says, “Exit if a down day comes with increased volume.” This BTC example builds its view around two pullbacks, so this series' plan focuses on testing whether support has been broken. If a subsequent completed daily candle sells off on increased volume and erases the hourly chart's recovery, then even if the local stop has not been triggered, exit or cancel according to the pre-set conditions. The local stop and the higher-timeframe review serve different purposes; the former does not wait for the latter.
This is another way to set conditions; there is no evidence that it is better than the book's exit method. If you chose in advance to “exit if a down day comes with increased volume,” then execute when that condition occurs. Do not add “it also has to break below T” at the last minute. Plans can be compared, but when executing, you cannot pick whichever rule is most favorable to your position.
Later: how much did the daily chart confirm?
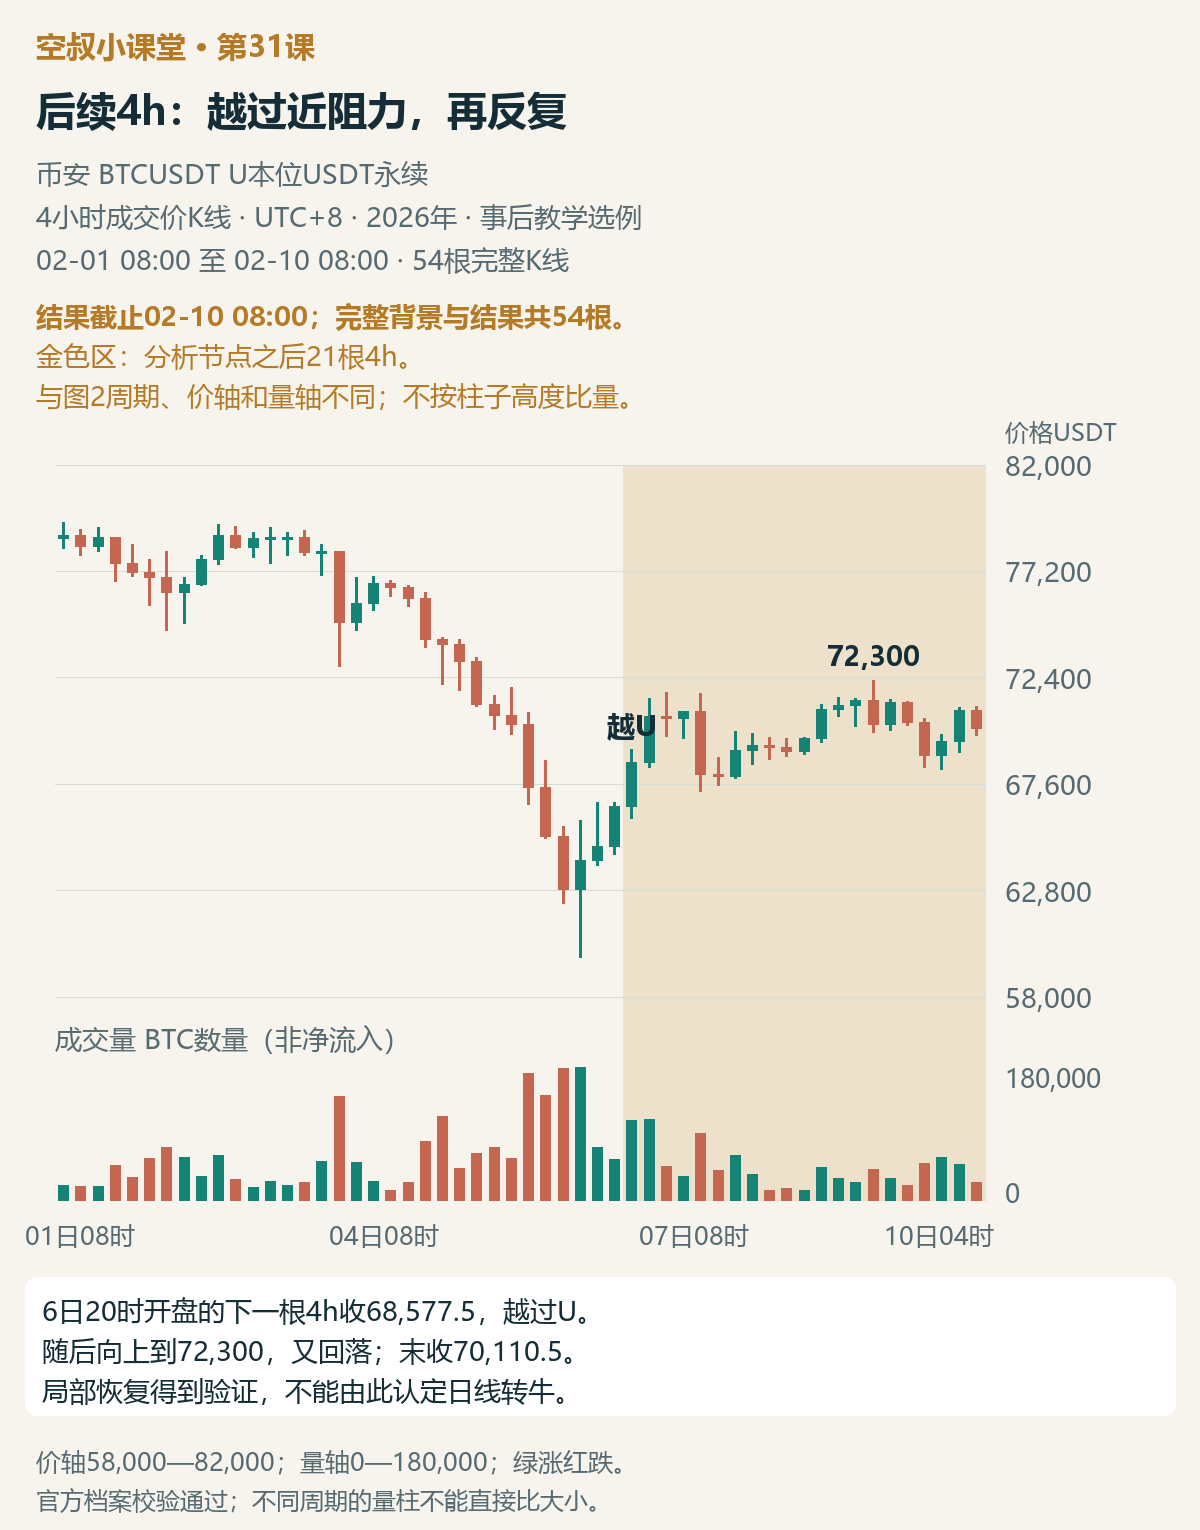
Figure 4 | Outcome through February 10, 08:00; 54 complete 4h candles. The gold area shows the 21 candles after the analysis point; the timeframe and price scale differ from those of the hourly chart.
Next, the 4h candle that opened on February 6 at 20:00 broke above the U high, and its high also exceeded the previous area around 68,667. The expectation of a local advance was the first to be tested.
Only after the daily candle actually closed could we get the next layer of answers.
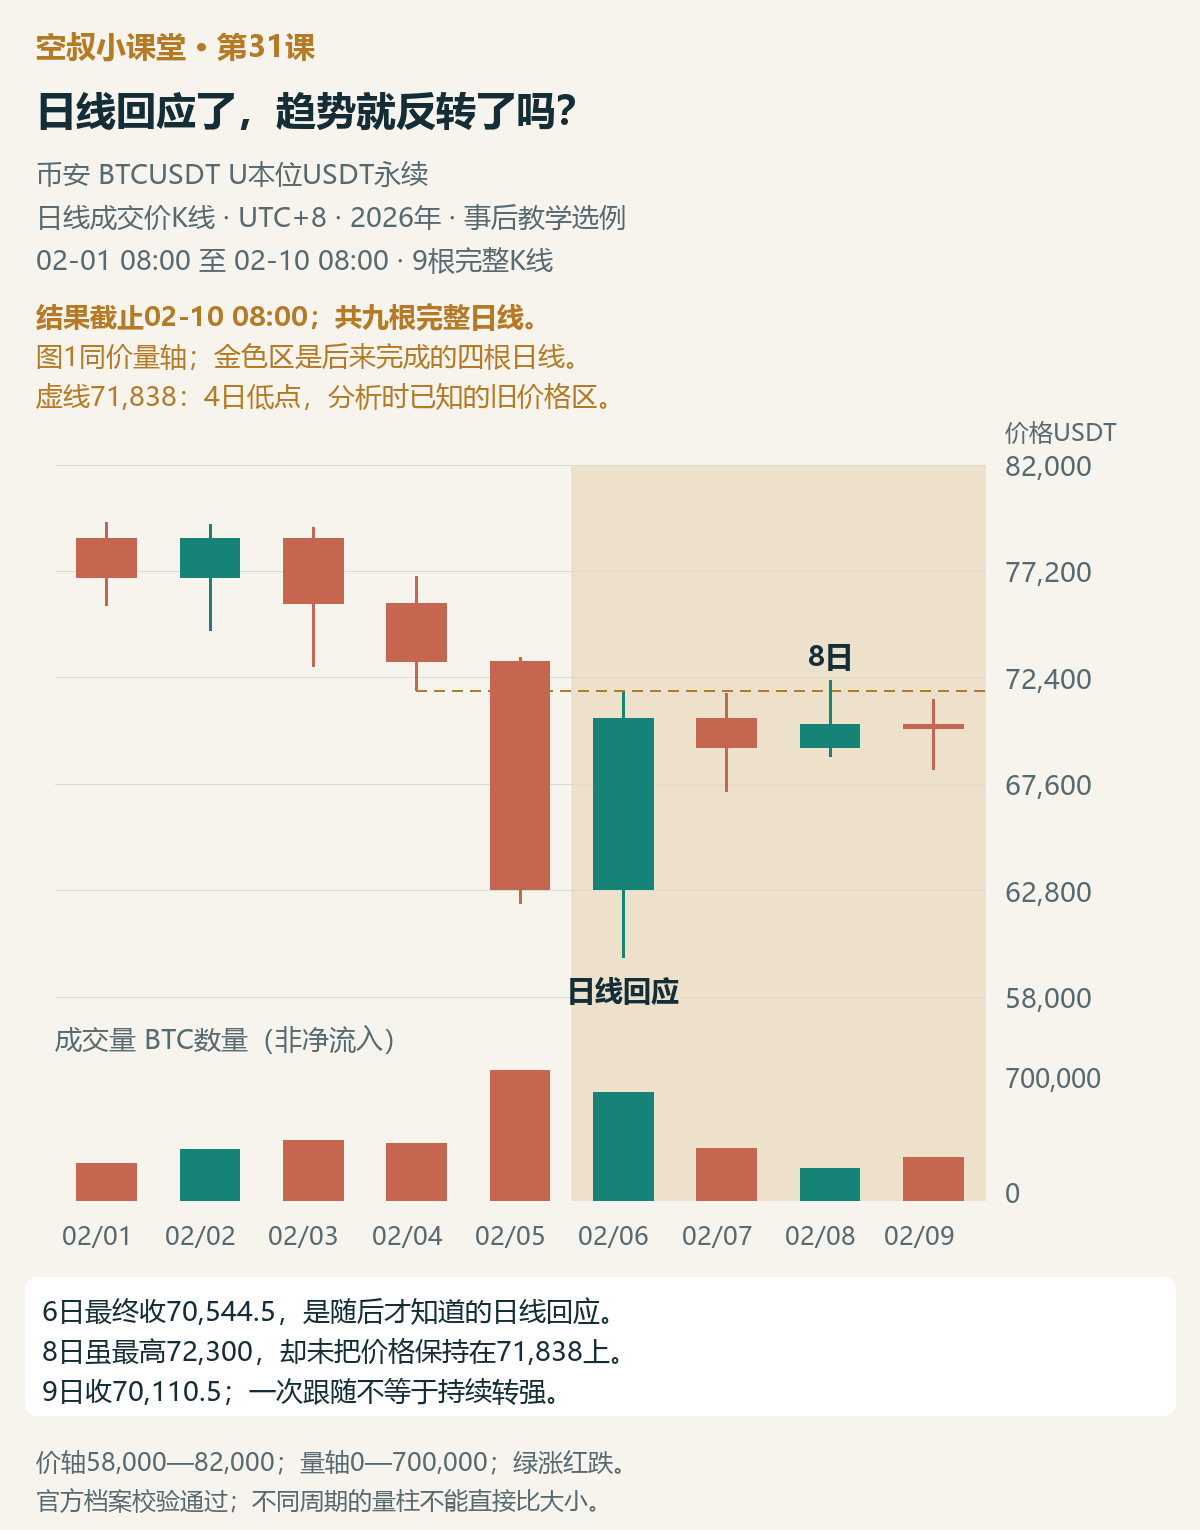
Figure 5 | Nine complete daily candles from the same market move, with the same price and volume axes as Figure 1. The gold area shows the four daily candles completed later; the dashed line at 71,838 marks the April 4 low, which was known at the time.
The daily candle for February 6 completed at 08:00 on February 7, finally closing at 70,544.5 and showing a clear response from demand. This was the higher-timeframe confirmation that came afterward.
After that, price pulled back on lower volume on February 7, rebounded again on February 8 to a high of 72,300, but failed to hold above 71,838; on February 9 it closed slightly lower again. The outcome confirmed that the local rebound had advanced, and the expected daily response from demand also appeared. The move back above 71,838 and hold there did not materialize. The daily closes from February 7 through 9 were all below that price, so at the cutoff we still treat this rise as a rebound. To strengthen the higher-timeframe view, we would need evidence that price can recover above the old price area, hold there, and continue advancing. The later developments in the book's E, F, and G do not fully recur in this BTC move.
There is another detail on the February 9 daily candle worth comparing: its volume was higher than on February 8, and it closed below its open. If you had set “exit if a down day comes with increased volume” in advance as a rule for staying in the trade, you should act on it when this candle completes. Do not delay just because T has not been broken.
Under the structural conditions laid out in advance for this example, T had not been broken by the outcome cutoff, so price had not invalidated the support based on this pullback. That answers whether the local structure has failed; the daily-chart task of recovering above 71,838 remains unmet. Record the two tests separately. Do not treat “T has not broken” as a reason to conclude that the higher timeframe has turned bullish. We have not specified an actual trade entry or compared returns.
My takeaways
Lesson 30 looked at whether demand rejected a sharp selloff within the same 4h structure. This lesson connects the hourly chart's basis for participation with subsequent confirmation from the daily chart.
The specific view I formed this time is that, against a falling daily-chart backdrop, a recovery in hourly demand is enough to support a local long plan. Track the plan's progress by whether resistance can be reclaimed, and its invalidation by whether support at the pullback is broken. The chart gives us a basis for participation, expectations after entry, and a way to respond if those expectations are not met.
The basis for participation, daily-chart follow-through, and a sustained breakout belong to different stages. Each stage has its own test; pre-set stops and exit conditions must not be changed arbitrarily after seeing the outcome.
A short exercise
Look only at Figures 1 and 2, from the point of view of February 6, 20:00: What is your main view of the hourly chart, and which price-and-volume evidence matters most? What does this imply for a local long plan, and must a bullish daily close come first? Then identify nearby resistance, the invalidation reference that would change your view, and what the daily chart needs to confirm afterward. If you are already in a position, can the stop wait for the daily close? If you had separately set “exit if a down day comes with increased volume” in advance, could you delay because T has not broken?
Feel free to share your reasoning in the comments—don't just answer “up” or “down.” A suggested analysis will be added to the comments on this post later.