



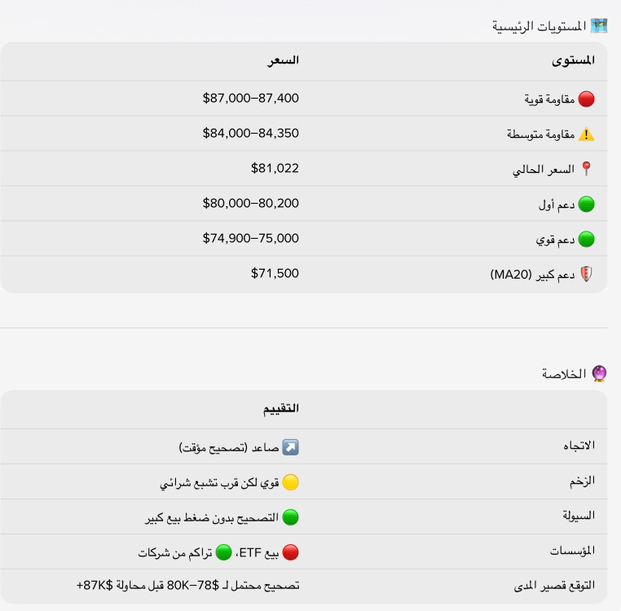
Price is above the weekly MA10 ($79,247) ✅
Price is above the weekly MA20 ($71,523) ✅
Price is above the weekly EMA21 ($76,178) ✅
But the last 2 consecutive weeks have been bearish since the $87,395 peak ⚠️
The big-picture trend is bullish, but it’s currently undergoing a healthy correction from the peak. This week is heading toward a close below last week’s open.
💪 Momentum
RSI(14) = 70.0 — on the verge of overbought territory. A warning signal, but not a confirmed reversal on the weekly timeframe.
 MACD histogram = +1,923 (positive and strong) — bullish momentum remains dominant
MACD is above zero and above the signal line — the technical environment favors the upside
---### 🧲 Liquidity and Volume
Volume during the major crash week (the week it hit $59,130): 231,929 BTC — extremely high volume indicating panic
Volume during the rebound weeks (77K→84K): elevated (108K–129K BTC) ✅ — a rally on strong volume
The last two bearish weeks: relatively low volume (98K and 57K BTC) — the decline came without strong selling pressure, a positive sign
The week of the drop from $87K to $83K: volume was 98K — below average (110K). This suggests the decline is weak and not genuine institutional selling.
🐋 Large-wallet buying and selling
Taker Buy ratio (buyers placing market orders directly) over the last 5 weeks: 49.3% — a balance between buying and selling
The sharply rising week (81K→84K): buy ratio of 51.9% — a clear tilt toward accumulation
Current week: buy ratio of 49.2% — neutral
Institutional news this week:
🔴 Bitcoin ETF: -$261M outflow in one day (institutional selling pressure)
🟢 Strive: purchased 2,822 BTC during the week (total holdings: 35,595 BTC)
🔴 U.S. CPI at 3.7% > expectations → rate hike concerns = pressure on Bitcoin