



[Bottom line first]
$ETH 2400 has already turned from “support” into “resistance.” Short-term outlook: as long as ETH fails to reclaim 2500 (the 50-day moving average), expect choppy trading with a bearish bias. The real battleground is 2390; a daily close below that level would confirm a breakdown.
I. What happened
The catalyst for this downturn was U.S. CPI coming in higher than expected. After the data was released, Treasury yields rose and then fell, and risk assets followed suit. According to CoinDesk, BTC fell around 2% over 24 hours, returning to around $81,000. ETH dropped more, by around 3.7%.
Viewed over a longer time frame, ETH was above $2,700 a week ago and has since pulled back around 7%–10%. Since its all-time high of $4,950 in August 2025, the price has been cut in half.
ETH fell more than BTC, indicating that when risk appetite declines, investors first reduce exposure to assets with greater volatility.
II. Technical analysis: 2400 is a zone, not a single line
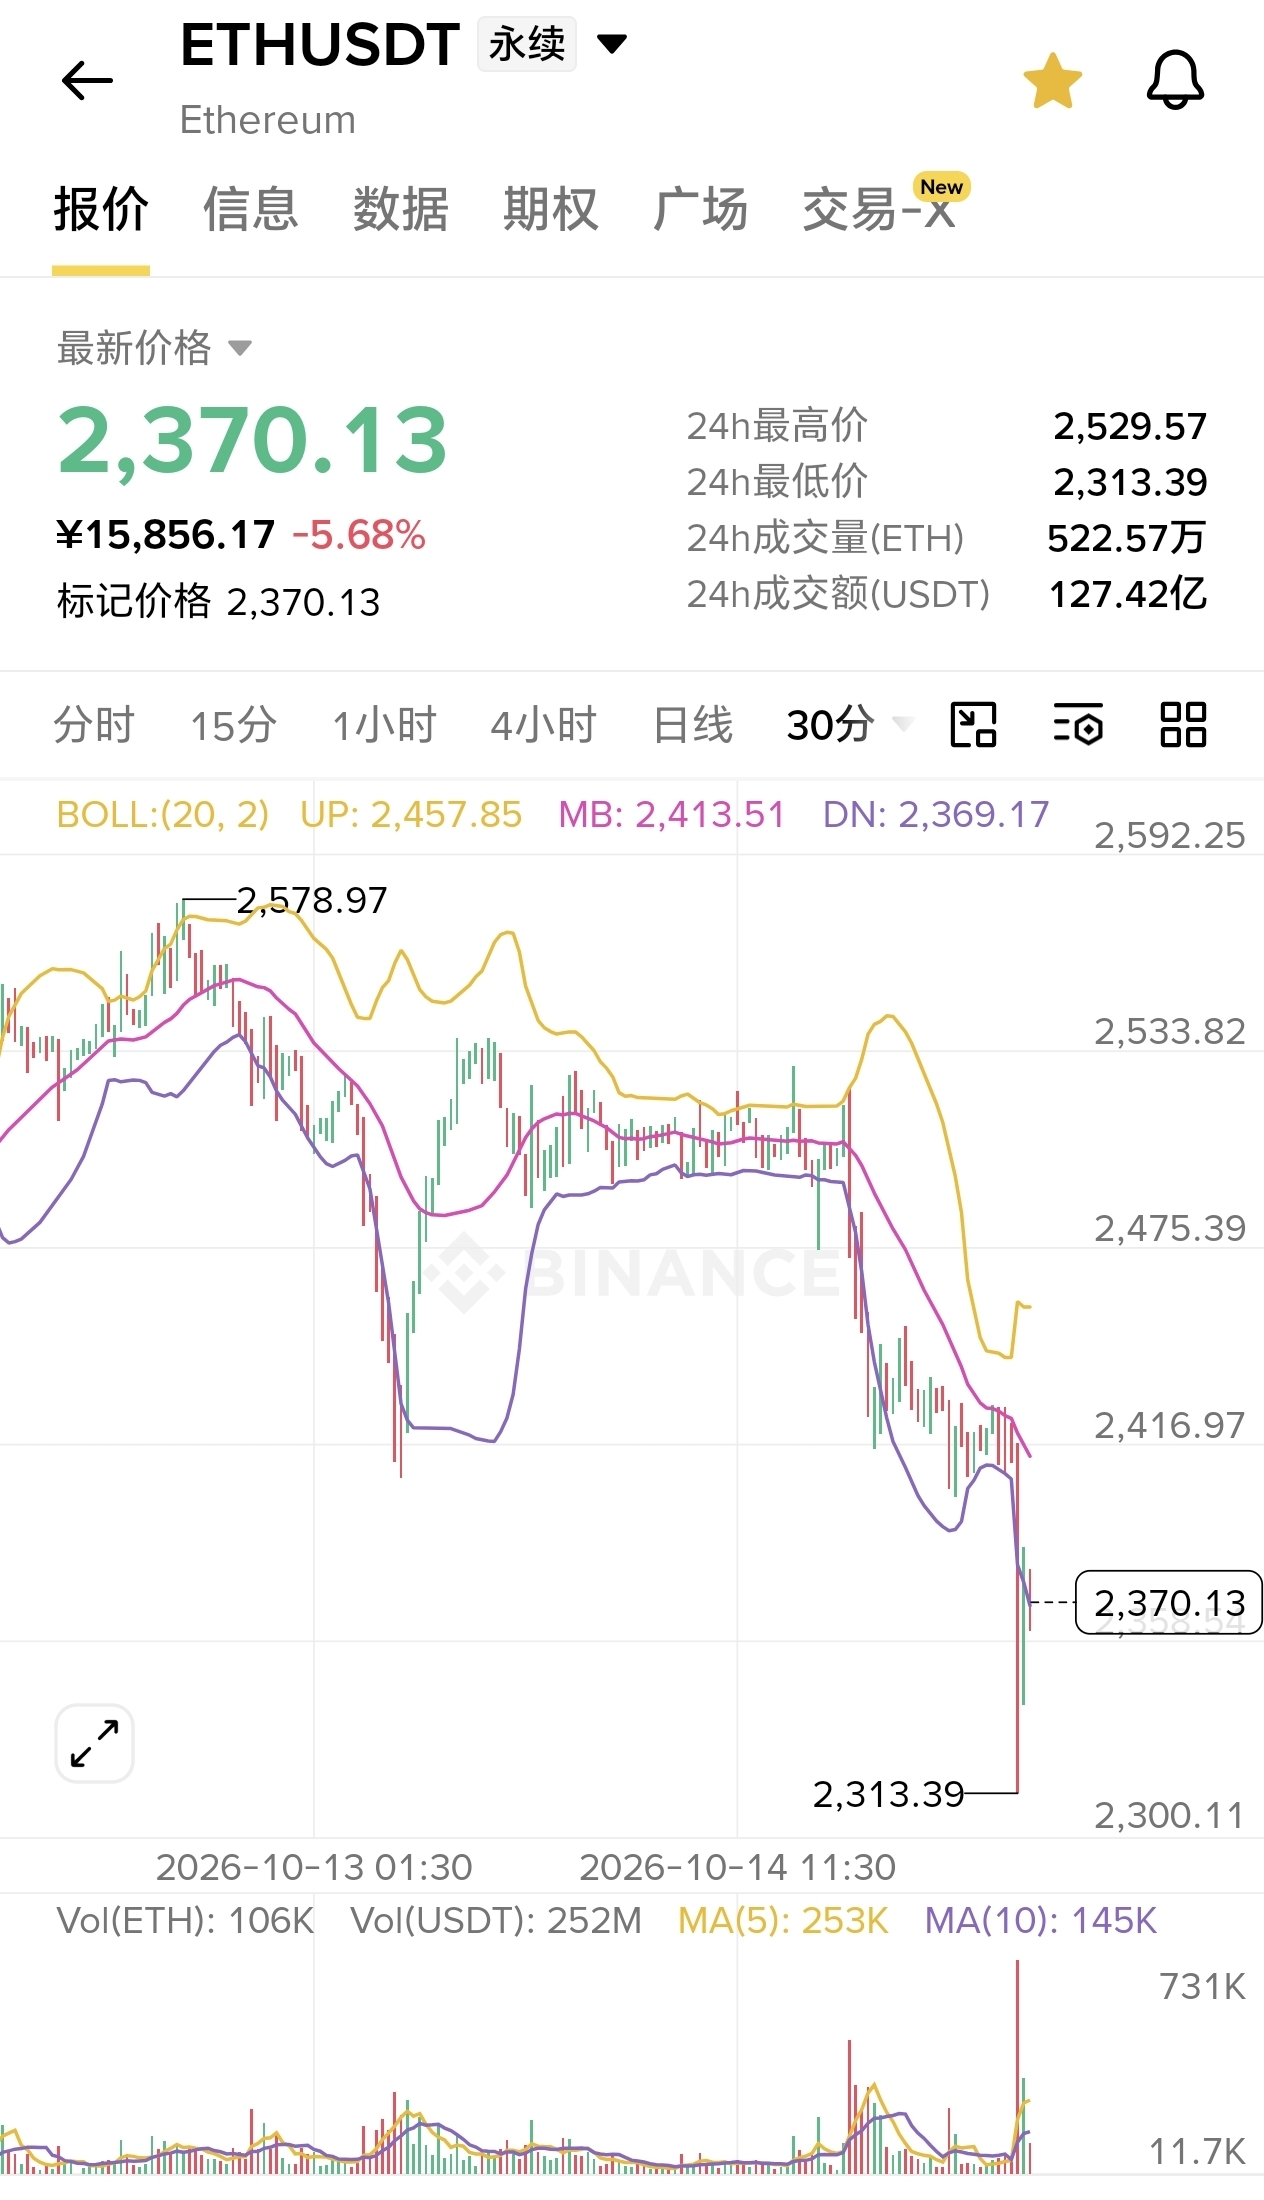
I focus more on raw candlesticks and price action for ETH. Key levels are as follows:
2500: The 50-day EMA and the first resistance above. Until price reclaims it, any rebound should be considered weak.
2435: The 0.618 Fibonacci retracement level. Losing this level suggests weak support below.
2390: The daily head-and-shoulders neckline the market is watching. It is only confirmed by a daily close below this level; an intraday wick does not count.
2776: The invalidation level for the head-and-shoulders pattern. A daily close above it invalidates the pattern.
One point to note: an intraday break below 2400 is different from a daily close below 2400. Many people get shaken out by a wick because they only look at the intraday price.
III. Flows: Don’t just look at price
Spot ETF flows offer a window into institutional sentiment. Reports indicate that ETH spot ETFs previously saw net outflows for 10 consecutive trading days before briefly turning to net inflows, but it is too early to confirm whether this will last. The rule of thumb is simple: net inflows for several consecutive days indicate a trend reversal; a single day of inflows is just noise.
Before publishing, consider adding Coinglass funding-rate and liquidation data: persistently negative funding rates indicate crowded shorts, which can lead to a short-squeeze rebound; price levels with concentrated long liquidations are risk zones where a decline could accelerate.
IV. Three scenarios
Scenario
Trigger condition
What it means
Bearish (primary scenario)
Rebound stalls at 2435–2500
Another test of the lower end of the range at 2390
Breakdown
Daily close < 2390
Head-and-shoulders pattern confirmed, opening up further downside
Turning bullish
Daily close above 2500, moving toward 2776