

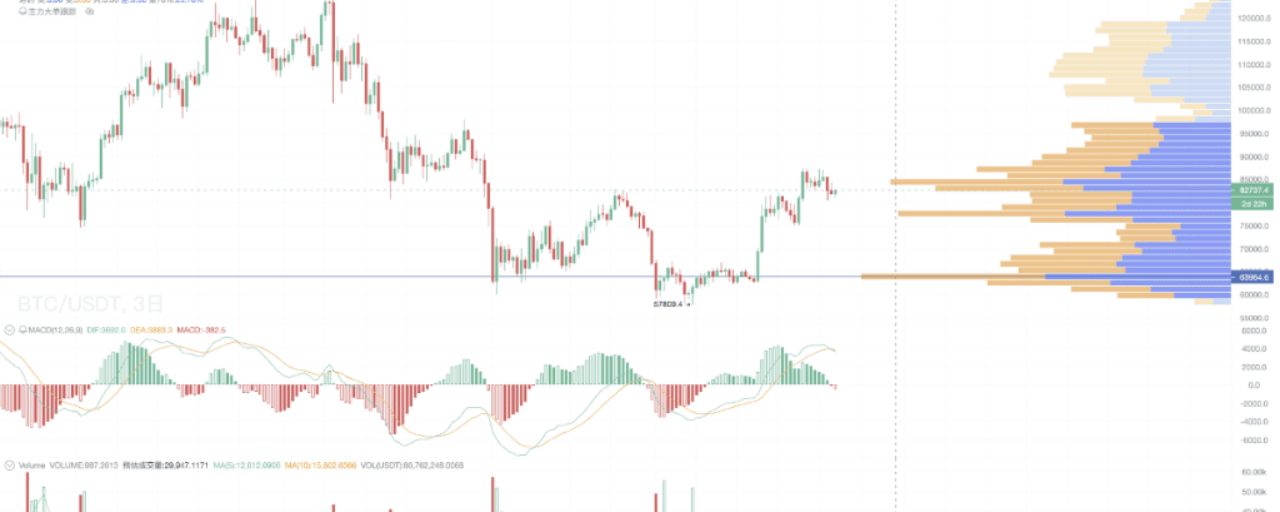

As soon as the National Day holiday ended, Bitcoin’s chart gave everyone a “rude awakening”—not the kind that comes from a sell-off, but the kind that leaves you second-guessing.
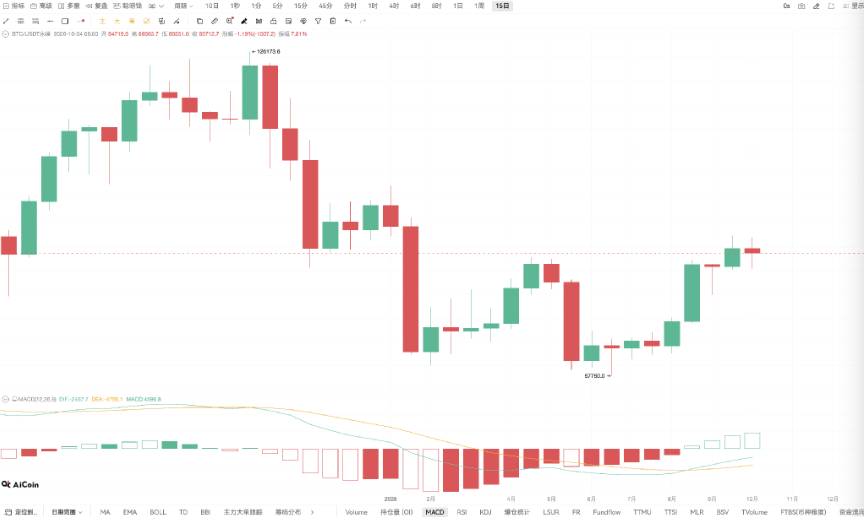
Looking back at this rally: the price recovered steadily from around $57,800, rebounding to above $87,000. Up more than 50%, and just as the community started buzzing about the “early stages of a bull market” and the hype squad got into position—the three-day MACD flashed a death cross: DIF crossed below DEA, and the histogram turned green and negative.
The bulls probably feel like they’d just lit the fireworks when someone dumped a bucket of water on them.
The bull market has barely shown its face—are we already taking a turn?
First, don't panic. Let's anchor ourselves to the market action from 16:00 to 16:57 Beijing time on October 13, 2026. The prices, indicators, and sentiment reflected that moment's context—we're not going to play Monday-morning quarterback.
My view is clear, and it comes down to three points:
First, the bottoming process is complete. From $57,800 to above $87,000, this wasn't just a rebound—the structure shows a genuine rise from the bottom. The foundation for a bull market is already in place.
Second, the current move looks more like “an early-bull-market pullback” than the end of the bull market. A pullback is not the same as a trend reversal. These two have been confused countless times throughout history, and every time, people start shouting, “The bull market is over!”.
Third, confirmation depends on whether buyers step in at key levels. A death cross is a reminder to “slow down,” not a command to “jump out of the car.” If the pullback finds support at key levels and stabilizes on declining volume, the early-bull-market thesis remains intact. If support fails, there's still time to revise the view—the market is about levels, not emotions.
Now, about the death cross itself. What does a three-day chart mean? It filters out most short-term noise, so a death cross on the three-day chart is certainly worth taking seriously. I won't downplay that. But there's an entire observation period between “worth taking seriously” and “declaring it dead.”
Issuing a death notice for the bull market based on a single death cross is a little premature. Indicators are always the rearview mirror; price levels are the steering wheel.
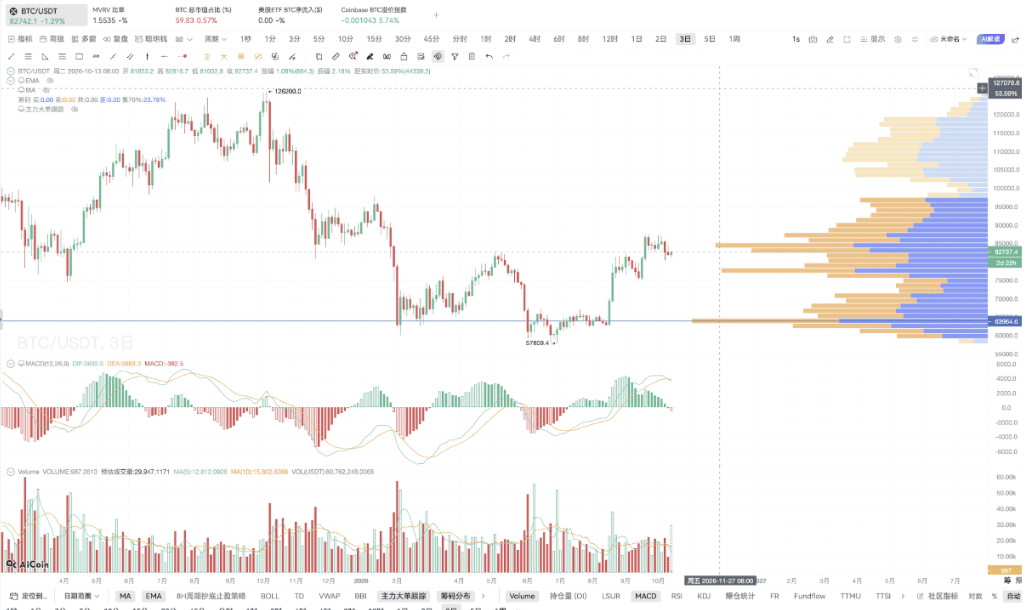
Looking back at this rebound, the July rally began near $57,800. After recovering the $64,000 area, price broke above $76,000 and briefly reached a high of $87,400. This advance repaired the bottoming structure and prompted the market to discuss the possibility of an early bull market again. However, price later returned to around $82,700, while daily momentum weakened at the same time, putting the medium-term outlook into a confirmation phase.
A death cross signals weakening momentum, but the direction from here still depends on price structure. It is a trend-confirmation signal and usually lags behind price. If the market holds above key support, the MACD histogram bars may gradually contract. If price breaks through support levels one after another, the negative bars will often grow, and BTC could return to the $70,000 range. If it gets there, the priority should be to watch for support—not to rush in just because the price looks low.
One more detail is worth noting: after BTC surged from around $64,000, it spent quite a while in the $84,000–$87,000 range. Trading at these elevated levels built up new cost bases among holders and added to selling pressure during the pullback. So this correction is both digesting earlier gains and testing how much genuine buying demand is in the market.
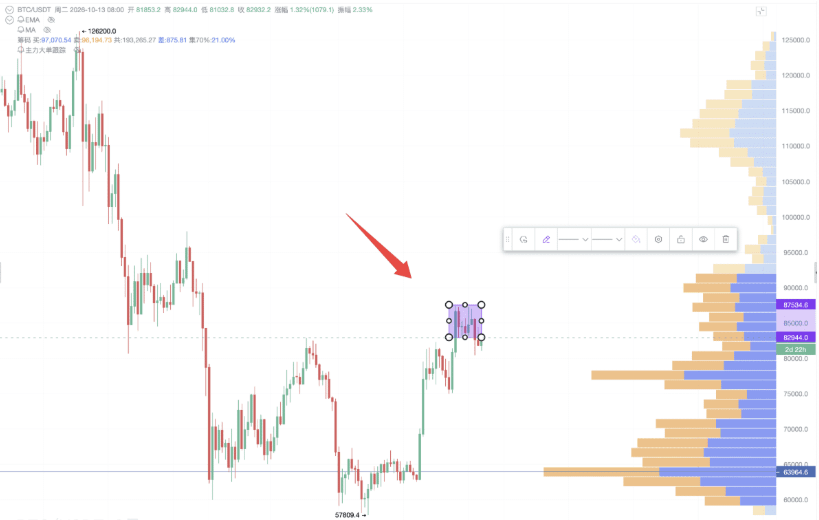
After reviewing the three-day chart, let's put the daily chart and the distribution of holdings together. At the time, the daily MACD was also in a death cross, with the negative histogram bars still extending. The daily chart weakened first, followed by confirmation on the three-day chart, suggesting short-term pressure had spread to the medium-term timeframe. Price was still holding above $82,000 and had not yet reached the main holder cost-basis zone around $77,000.
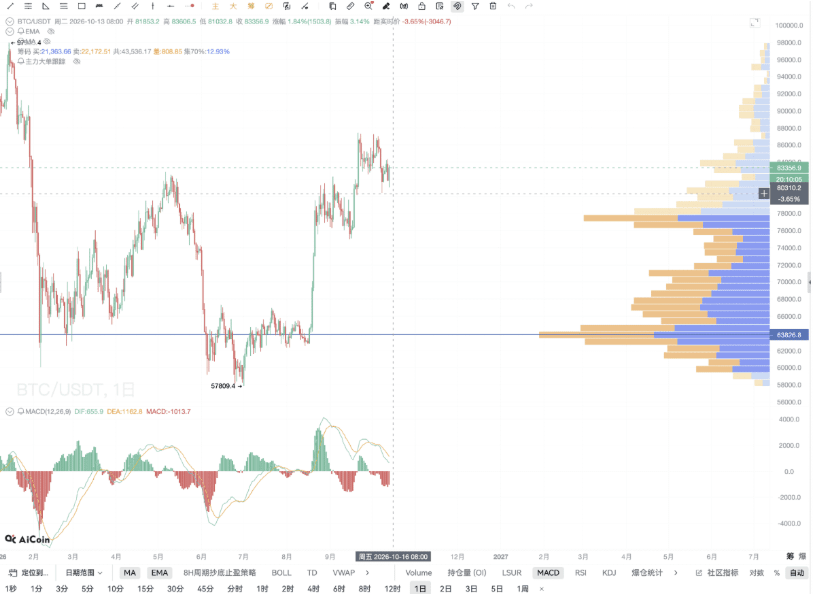
The first level to watch above is $84,000. Reclaiming and holding this level would mean that some of the short-term selling pressure had been absorbed. Higher up, $87,000 is a more important confirmation threshold: BTC needs to break through on strong volume and hold for several days before the pressure from the three-day MACD death cross can begin to ease. A break above $87,000 could serve as a signal to watch for the start of a major upward move, but the key is whether price can hold there.
The key area to watch below is $75,100–$77,200. The four-hour distribution of holdings showed a lot of trading activity in this zone, and around $77,200 also overlaps with a previous consolidation range. If price returns here and sees strong buying on higher volume, the early-bull-market thesis can still hold, and this drop would look more like a pullback before the trend takes off.
If $75,100 fails to hold, the price structure will need to be tested at the next level, and the earlier early-bull-market assessment will need to be reconsidered. $64,000 is the key cost-basis zone formed after this cycle's bottom, with a higher concentration of holdings. If BTC returns there, much of the advantage built up by this breakout will have eroded, and the market will need to rebuild its medium-term structure.
You don't need to memorize these levels like exam answers; just remember the general order of assessment: $87,000 is for breakout confirmation, the area around $76,000 is for gauging support on a pullback, and if that level also fails, watch for a move toward the $64,000 region to find support. Based on the market at the time, I leaned more toward a pullback before a major upward move and was less pessimistic about a correction all the way to the $60,000 range. Still, this is just an assessment; if price doesn't cooperate, we have to reassess.
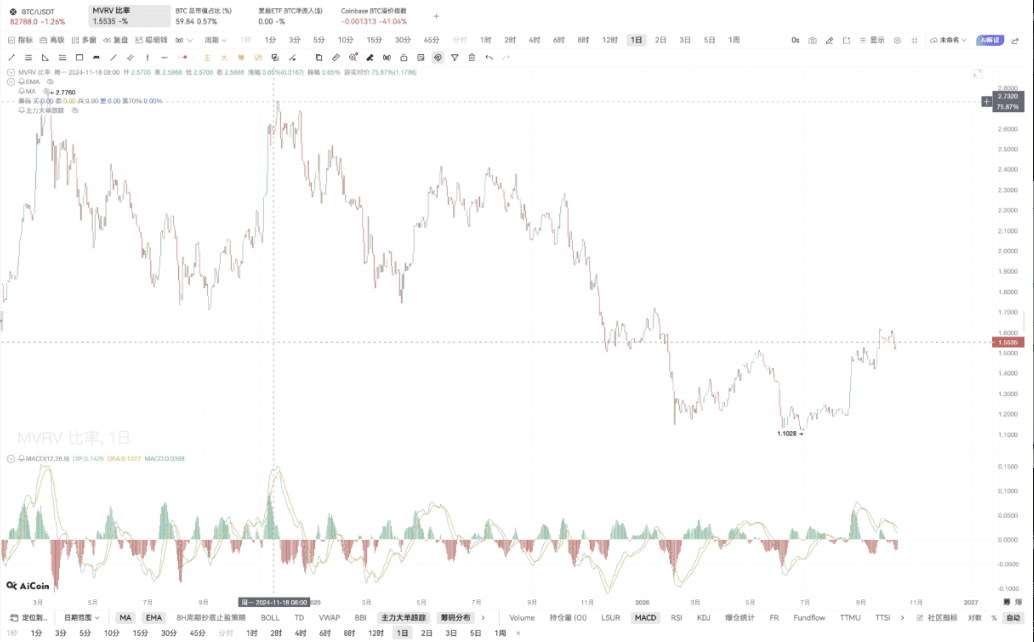
Why do I lean toward a pullback? Beyond the candlestick chart, we can also look at MVRV. Put simply, it compares market valuation with the cost basis of on-chain holdings. A ratio above 1 means the market as a whole has accumulated some unrealized gains. MVRV was around 1.55 at the time, above the roughly 1.10 level near this cycle's low, while still below historically overheated levels. This leaves room for further gains, but also reminds us that holders have profits to take, so selling pressure during a pullback is possible.
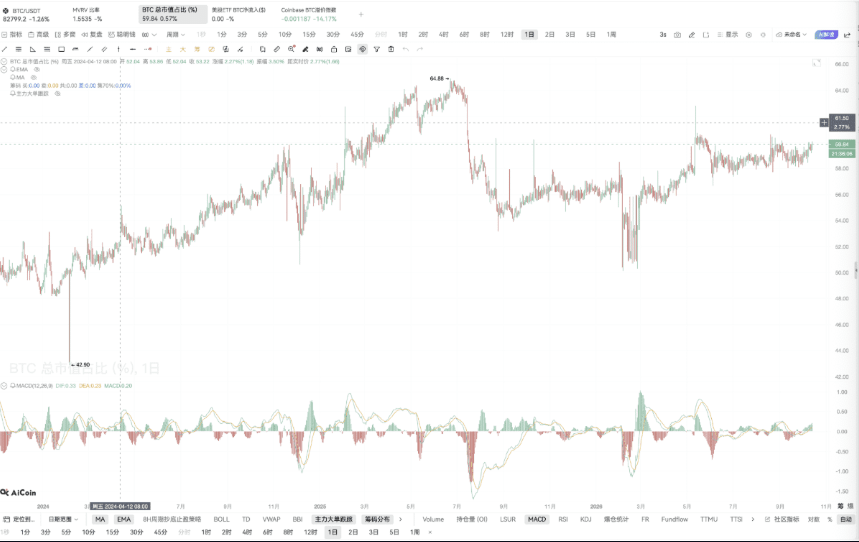
BTC's market share was around 59.84% at the time and had continued to rise recently. The continued concentration of funds in Bitcoin suggests a strong market preference for core assets. It also reflects weak demand for altcoins, with no real broadening of capital flows yet. In the early stages of a bull market, BTC often attracts liquidity first; we'll need to see whether ETH and other major assets can catch up later.
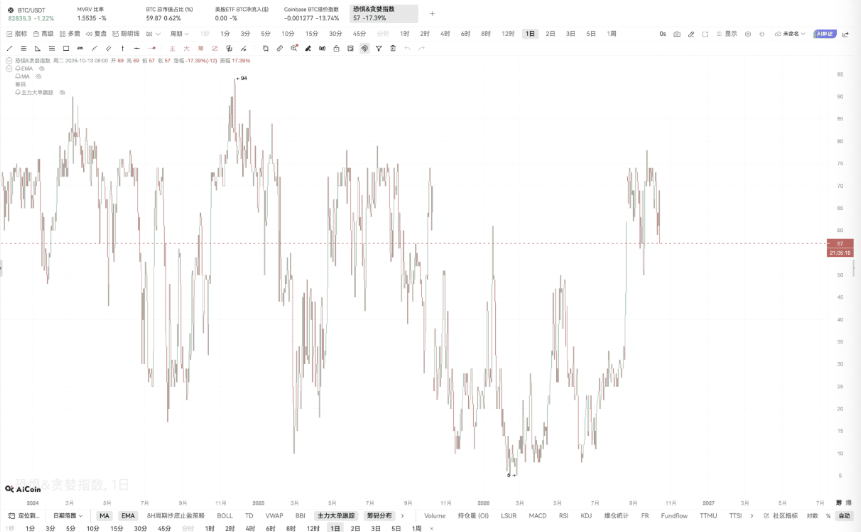
On sentiment, the Fear and Greed Index fell to 57. It had retreated from elevated levels but was still in neutral-to-optimistic territory. People were still willing to participate, though their enthusiasm for chasing prices had cooled. Putting these data points together, I would interpret BTC at the time as being in an early-bull-market pullback: the bottoming structure and valuation recovery provided support, while the three-day MACD death cross and weak U.S. spot buying were sources of pressure.
Of course, we can't focus only on candlestick charts. The October 13 discussion also coincided with a busy event window: earnings from U.S. banks, the upcoming CPI release, and ASML's third-quarter results. The economy, inflation, and AI demand were all about to be tested, and the results could affect dollar liquidity and risk appetite—and, in turn, whether BTC would first move up to test resistance or down to find support.
For bank earnings, the main names we were watching at the time were JPMorgan Chase, Goldman Sachs, Citigroup, and Wells Fargo. Their direct impact on BTC is limited; what matters more is whether they help us assess if new credit stress is emerging in the U.S. Earnings growth is worth watching, of course, but we shouldn't overlook loan-loss provisions, credit card charge-off rates, or delinquency rates.
The framework I used at the time was this: if loan-loss provisions came in no more than 5% above market expectations, credit quality could generally be considered stable. If they exceeded expectations by more than 10%, while credit card charge-off and delinquency rates were also rising, we would need to watch for signs of pressure on consumer spending. These figures were conditions to monitor in this discussion and should be considered alongside other credit data. If the results matched expectations for continued bank earnings growth and stable credit quality, the market impact would usually be limited. But if credit data weakened significantly, U.S. stocks and BTC could come under pressure, and we would then look at whether falling Treasury yields could provide support.
Next up is CPI. The discussion at the time was that U.S. September CPI would be released at 20:30 Beijing time on October 14. Anyone following the evening market should keep that in mind. The official release should be taken as the authority on the exact release time and results; the figures and expectations here are those discussed on October 13.
The August data cited at the time were: headline CPI rose 0.4% month over month and 3.4% year over year; core CPI rose 0.3% month over month and 2.4% year over year. The forecast for September was that headline CPI could rise to 3.6%–3.7% year over year, while core CPI could slow to 0.2% month over month. These were all reference figures discussed at the time, not September results that had already been released.
When looking at the data, what matters most is the gap between the actual reading and expectations. If the figure comes in below expectations, Treasury yields and the dollar may ease, while Nasdaq valuations could get some support. If it comes in above expectations, the market will reprice the rate path, putting pressure on tech valuations, and BTC will need to hold $82,000. If that level gives way, it could fall further toward $76,000. ASML's third-quarter results are another important item to watch in the same window for signs of demand across the AI supply chain.
Back to the charts: at the time, I also took another look at the customized long-term MACD chart, where the bullish crossover signal had not yet been confirmed. This pointed in the same direction as the earlier assessment: momentum recovery still required patience and observation.
Putting charts from different timeframes side by side, along with the distribution of holdings and the levels where large players placed big orders, makes the approximate pullback zone clearer. The main disagreement was about how deep the correction would be. At the time, I was more inclined to view the area around $70,000 as a zone to reassess where holders might step in, rather than to conclude that prices would slide all the way back to $60,000. If BTC did reach the $60,000 range, we would need to revisit the earlier assessment of whether the bear market had ended.
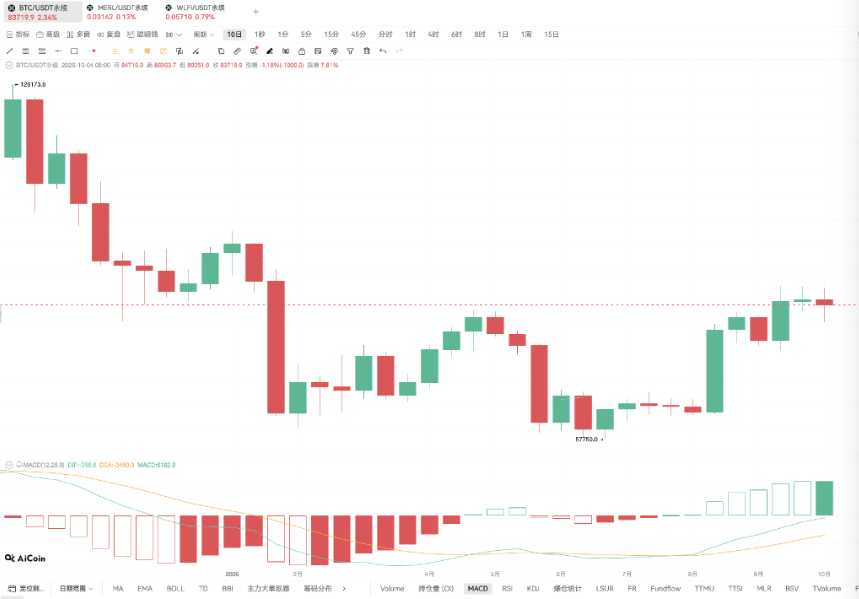
Next, keep an eye on four signals: whether BTC can hold $82,000, whether buyers step in around $76,000, whether the Coinbase premium returns to positive territory, and whether ETF flows resume a sustained run of inflows. Gradual improvement across all four would lend more credibility to a break above $87,000. If fund flows remain weak, price could move lower to test the holder cost-basis zone.
Ultimately, the bottom has begun to recover, but price action and fund flows will have to show whether an early bull market can be confirmed. This is just my read of the market on October 13. Keep an eye on your positions, allocate sensibly, and leave yourself some room to adjust. Small investments are fun; big investments make your hair fall out—and the market hasn't even made its move yet, so don't let your hair go first.
$BTC
