


Market structure is the foundation of technical analysis. It helps traders understand where the price is heading: up, down, or sideways.
To learn how to read a chart, you need to understand the three market conditions: an uptrend, a downtrend, and consolidation.
1. What Are Highs and Lows?
A high is a local peak in price movement from which the price begins to fall.
A low is a local bottom in price movement from which the price begins to rise.
Highs and lows help determine the market's direction and show whether the current trend is still intact.
2. Uptrend
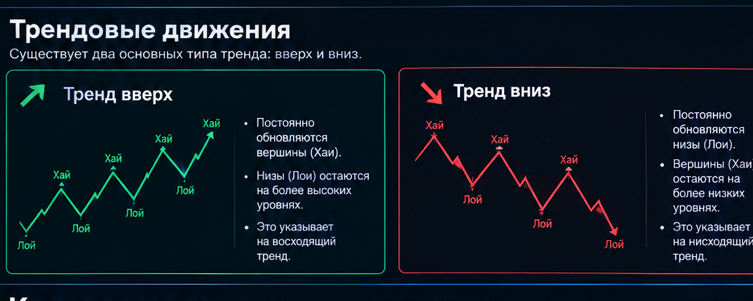
An uptrend forms when the price successively makes higher highs and higher lows.
HH (Higher High) — a higher high.
HL (Higher Low) — a higher low.
In this situation, buyers are showing strength: the price rises to new peaks, and pullbacks stop above previous lows.
Conclusion: A sequence of HHs and HLs indicates a bullish market structure.
3. Downtrend
A downtrend forms when the price successively makes lower lows, while peaks become lower than the previous ones.
LL (Lower Low) — a lower low.
LH (Lower High) — a lower high.
This indicates that selling pressure is dominant: after each rebound, the price continues to fall and makes new lows.
Conclusion: A sequence of LLs and LHs indicates a bearish market structure.
4. Consolidation (Range / Sideways Market)
Consolidation is a market condition in which the price moves within a specific range without a clear uptrend or downtrend.
The upper boundary of the range is called resistance, and the lower boundary is called support.
During this period, buyers and sellers are relatively evenly matched. The price may test both boundaries repeatedly without forming a sustained directional move.
What should you pay attention to?
Support is an area where the price has previously encountered buying interest.
Resistance is an area where the price has previously encountered selling pressure.
A breakout is when the price moves beyond the boundaries of a range.
Acceptance is confirmation that the price can hold beyond the broken boundary.
A strong move up or down may begin after consolidation. However, not every breakout is genuine: the price may return to the range.
5. How to Apply Market Structure in Trading
Before opening a trade, answer a few questions in order:
What recent highs and lows has the price formed?
Are the highs and lows moving upward or downward?
Is the price trending or moving in a range?
Where are the nearest support and resistance levels?
Is there confirmation of the expected direction of movement?
Do not make a trading decision based solely on a single high, low, or breakout. It is important to consider the overall chart context, the timeframe, and the risk of the trade.
Conclusion
Market structure is one of the basic tools traders use. It helps organize chart analysis, determine the direction of price movement, and spot when the market shifts from a trend to consolidation or vice versa.
Remember the key point: bullish structure is HH and HL, bearish structure is LL and LH, and consolidation is price movement within a range.
First learn to read market structure correctly, and only then move on to looking for trade entries.