

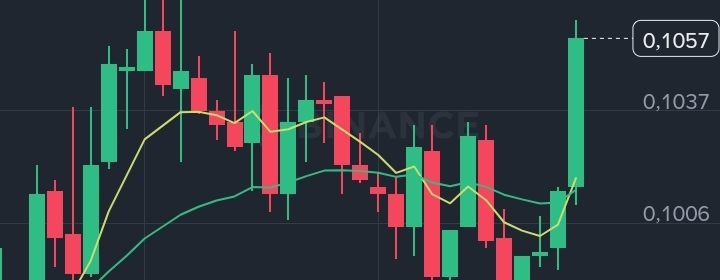

Based on the attached image of the A/USDT trading pair, here is a comprehensive technical analysis of the current situation:
📊 Basic data (24 hours)
· Current price: 0.1057 USDT
· Change: +7.31% (strong increase)
· Highest price: 0.1062
· Lowest price: 0.0982
· Trading volume (USDT): 421,179.55
(Note: The dates shown on the chart indicate 2026, which is unusual and may be due to an error in the device or trading platform settings. Therefore, we will focus on the technical analysis of price movements regardless of the date.)
📈 Technical Analysis and Indicators
1. Overall Trend:
The short-term trend is bullish. We can see a recent large green candle that broke above previous levels, indicating strong buying pressure after a period of correction and decline that reached a low of 0.0951.
2. Moving Averages (EMAs):
· The current price (0.1057) is trading clearly above the 7-, 25-, and 99-period moving averages.
· Current alignment: EMA(7) 0.1018 > EMA(25) 0.1015 > EMA(99) 0.0989. This alignment supports the bullish trend and indicates that short-term momentum is stronger than medium- and long-term momentum.
3. MACD Indicator:
· The DIF line (0.0001) crossed above the DEA line (-0.0000), a positive bullish crossover.
· The MACD histogram turned green (0.0001), confirming a shift in momentum from selling to buying.
4. Trading Volume:
The trading volume on the latest green candle (1.16M) is higher than the 5- and 10-period volume moving averages (606K and 687K), lending credibility to the current bullish rebound.
🎯 Support and Resistance Levels
· Resistance:
· Immediate resistance is the 24-hour high at 0.1062. A sustained break above this level could open the way toward the previous peak at 0.1092.
· Support:
· The first support level is around the short-term moving averages at 0.1015–0.1018.
· The next strong support is the recent low at 0.0951 (near the EMA 99 at 0.0989).
💡 Summary and Recommendation
The current short-term outlook is positive. The strong breakout by the green candle, supported by the MACD indicator and trading volume, suggests the price may continue rising to test resistance at 0.1062.
· For traders: Consider entering long positions and taking profits near 0.1062. Place a stop loss below 0.1015 to reduce risk in case the price falls again.
Note: This analysis is based on technical indicators and is for educational purposes only; it should not be considered financial advice. Trading cryptocurrencies involves high risk.