

Gold’s trend today
A morning filled with light and joy! 🌟
Based on the attached images and analyses (an XAUUSD analysis using the ICT methodology and liquidity behavior, alongside U.S. CPI inflation data), I’ve prepared a comprehensive, well-structured analytical article for you. Here it is:
---
Gold Analysis (XAUUSD): Liquidity Map and Trading Strategy Ahead of the CPI Release
Introduction:
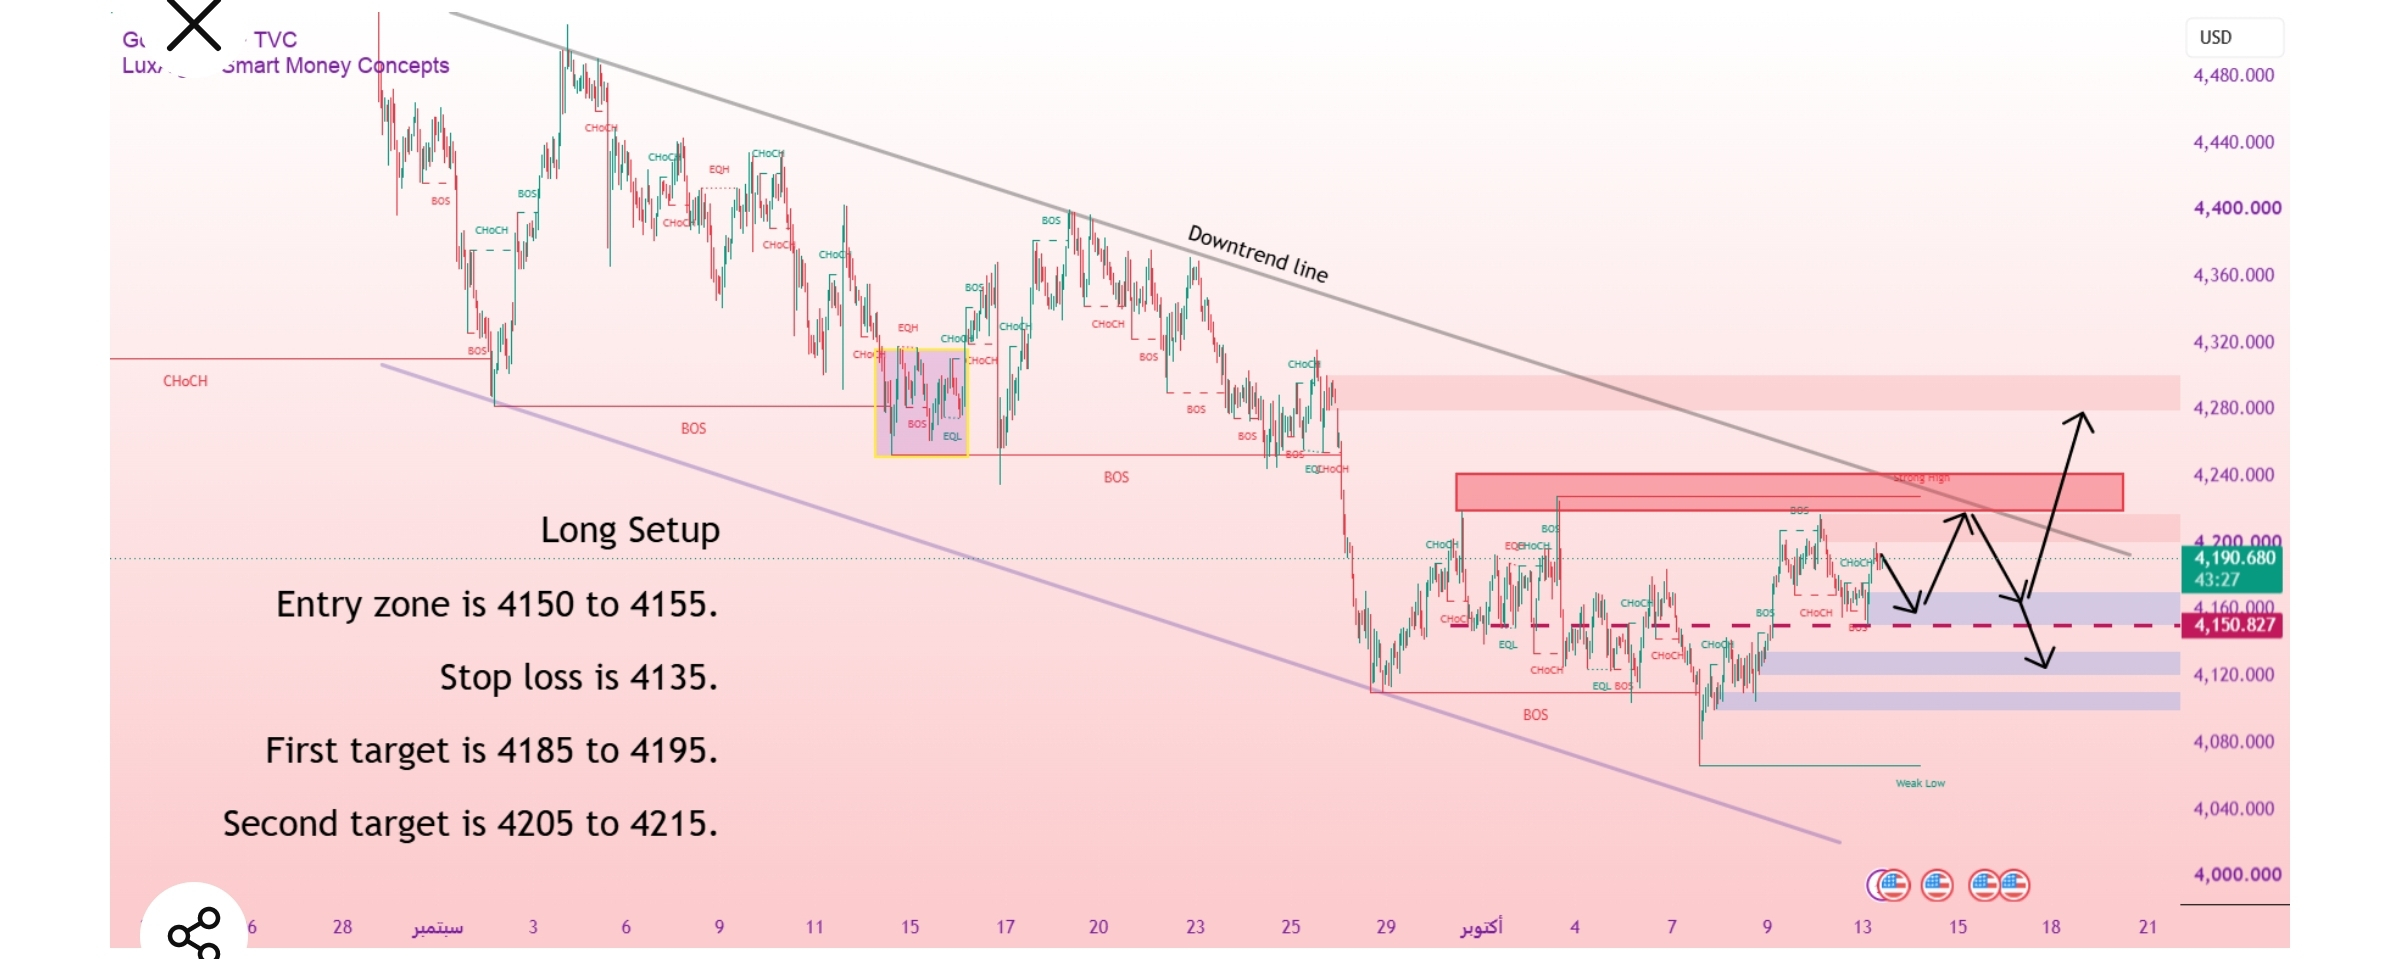
Gold is currently trading around $4,168.27, trapped within a choppy consolidation range ahead of a major economic event: the release of the U.S. Consumer Price Index (CPI) report and the open of the U.S. session. From the perspective of ICT / Smart Money Concepts, the yellow metal is poised for a Judas Swing—a price manipulation move designed to sweep liquidity from traders before the genuine move begins.
First: The Core Connection and Liquidity Driver (CPI Day)
CPI data is the biggest driver of liquidity this week. Major financial institutions rely on stop-loss orders and lure retail traders into late short positions in discount zones. Trading as the data is released is financial suicide, so it is advisable to wait for the “sweep candle” to reveal the direction of institutional liquidity.
Second: Expected Scenarios Based on ICT Concepts
1. Bullish scenario (macro factors supporting a rally — first and second blue paths):
If the inflation reading shows any slowdown or comes in line with expectations, Treasury yields and the dollar will fall, giving gold the institutional fuel to rally and fill Fair Value Gaps.
· Main liquidity target (Draw on Liquidity — DOL): the upper red band, representing untapped buy-side liquidity (BSL) at $4,275.83–$4,284.51.
· Price action: Even amid intraday volatility, technical analysis favors a brief “Judas Swing” to sweep sell-side liquidity and test demand zones (such as the FVG at 4,135.00–4,145.00 or a break below support at 4,154.77), followed by a bullish displacement candle and a break above the MSS/ChoCH levels at $4,207.73–$4,211.66, before surging toward the final target.
2. Bearish scenario (bullish outlook invalidated — red path):
If the inflation data comes in surprisingly high, price will break decisively below the $4,117.03 low and close a full one-hour candle beneath it. This close temporarily invalidates the bullish setup, with price then targeting a continuation of the structural decline toward $4,090 and even $4,050.
Third: Precise Price Levels (Trading Plan)
· Current price: $4,168.27 (equilibrium zone — no buying here).
· Liquidity trap trigger level (SSL): $4,154.77.
· First buy zone (FVG Zone): $4,135.00–$4,145.00 (discount zone).
· Deep buy zone (Bullish OB): $4,117.03–$4,126.99 (enter only if the price extends lower during the news release).
· Bullish structural break confirmation level (MSS / ChoCH): $4,207.73–$4,211.66.
· Final bullish target (BSL Target): $4,275.83–$4,284.51.
(Based on the attached chart: preferred entry 4150–4155, stop loss 4135, first target 4185–4195, and second target 4205–4215).
Fourth: Trading Guidelines and Risk Management
1. Avoid buying indiscriminately: Do not enter long positions at current prices (4,168), as they are in the equilibrium range and vulnerable to a sweep down into discount zones.
2. News-event maneuver: Avoid entering entirely while the CPI is released, and wait for the liquidity-sweep candle’s wick to complete, either in the green zone (4,135–4,145) or the blue zone (4,117–4,126).
3. Strict capital management: The recommended position size is just 0.01 lots, and no more than 1% should be risked per trade on major inflation news days like today.
Summary:
Gold is in a state of heightened anticipation. The real battle today is not about direction, but about entry timing. Wait for a “quick sweep” of liquidity below current prices, and look for strong rejection wicks to ride the institutional bullish move toward the highs.
---