【K-Line Basics, Lesson 5】Doji: Bulls and bears are evenly matched—now the market must choose a direction
There’s a type of candlestick where the opening and closing prices are almost identical, leaving the body as little more than a horizontal line. Bulls and bears have fought it out, and neither side has won. The candle itself isn’t important; the one that comes next is.
A doji represents “balance”: prices moved both up and down during the period, but the close returned near the starting point. Dojis often appear at turning points in a trend—when the side that had the upper hand suddenly loses momentum and the market enters a “let’s think this over” phase.
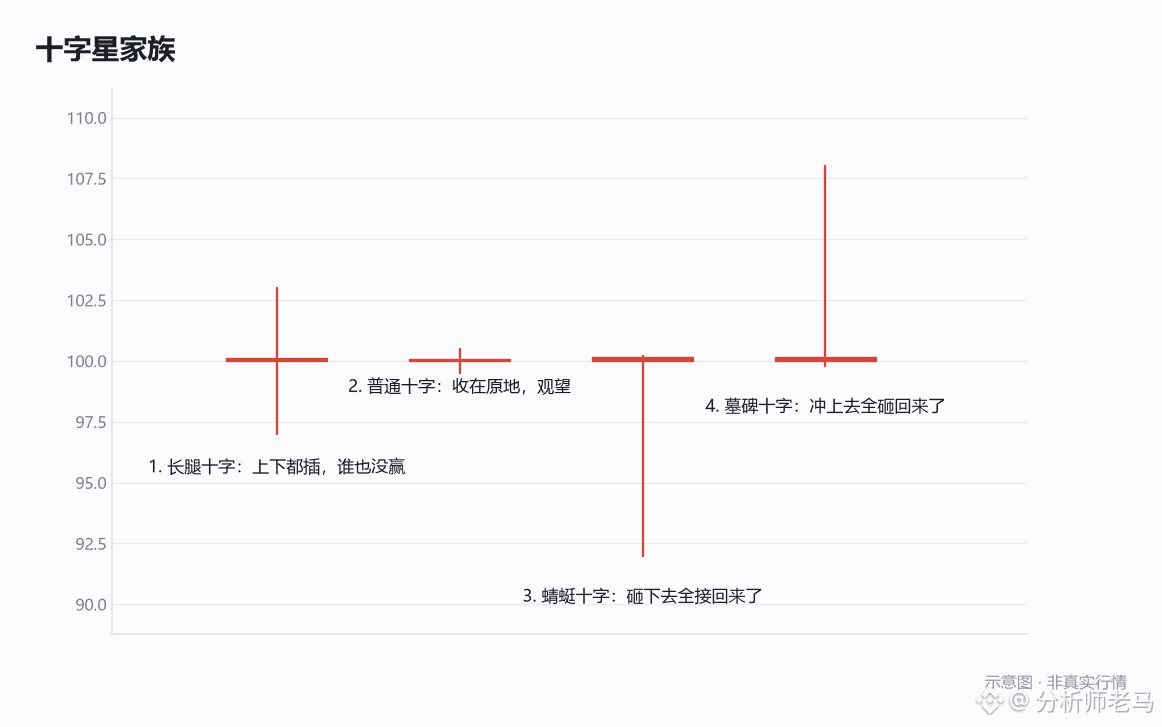
Here are a few types to know. ① Long-legged doji: long shadows on both sides signal intense tug-of-war, with the balance likely to be temporary. ② Standard doji: little price movement, and little significance—often safe to ignore. ③ Dragonfly doji: only a lower shadow—the price was pushed down, then fully bought back up; slightly bullish. ④ Gravestone doji: only an upper shadow—the price surged, then was fully pushed back down; slightly bearish.
A doji’s value is that it “reminds you to watch the next candle.” The rule of thumb is simple: look at which direction the candle after the doji closes. A close higher suggests the bulls have regained the initiative; a close lower points to the bears. The doji itself is not evidence for either direction.
When can it mislead you? A doji that appears in a sideways range is meaningless—the market is already balanced, so another record of balance tells you nothing. A doji only carries weight when it appears after a trend. Also, crypto markets trade 24/7, so a doji during the quiet hours of the early morning is often just a sign of thin liquidity. Don’t treat it as a signal.
#doji
There’s a type of candlestick where the opening and closing prices are almost identical, leaving the body as little more than a horizontal line. Bulls and bears have fought it out, and neither side has won. The candle itself isn’t important; the one that comes next is.
A doji represents “balance”: prices moved both up and down during the period, but the close returned near the starting point. Dojis often appear at turning points in a trend—when the side that had the upper hand suddenly loses momentum and the market enters a “let’s think this over” phase.
Here are a few types to know. ① Long-legged doji: long shadows on both sides signal intense tug-of-war, with the balance likely to be temporary. ② Standard doji: little price movement, and little significance—often safe to ignore. ③ Dragonfly doji: only a lower shadow—the price was pushed down, then fully bought back up; slightly bullish. ④ Gravestone doji: only an upper shadow—the price surged, then was fully pushed back down; slightly bearish.
A doji’s value is that it “reminds you to watch the next candle.” The rule of thumb is simple: look at which direction the candle after the doji closes. A close higher suggests the bulls have regained the initiative; a close lower points to the bears. The doji itself is not evidence for either direction.
When can it mislead you? A doji that appears in a sideways range is meaningless—the market is already balanced, so another record of balance tells you nothing. A doji only carries weight when it appears after a trend. Also, crypto markets trade 24/7, so a doji during the quiet hours of the early morning is often just a sign of thin liquidity. Don’t treat it as a signal.
#doji