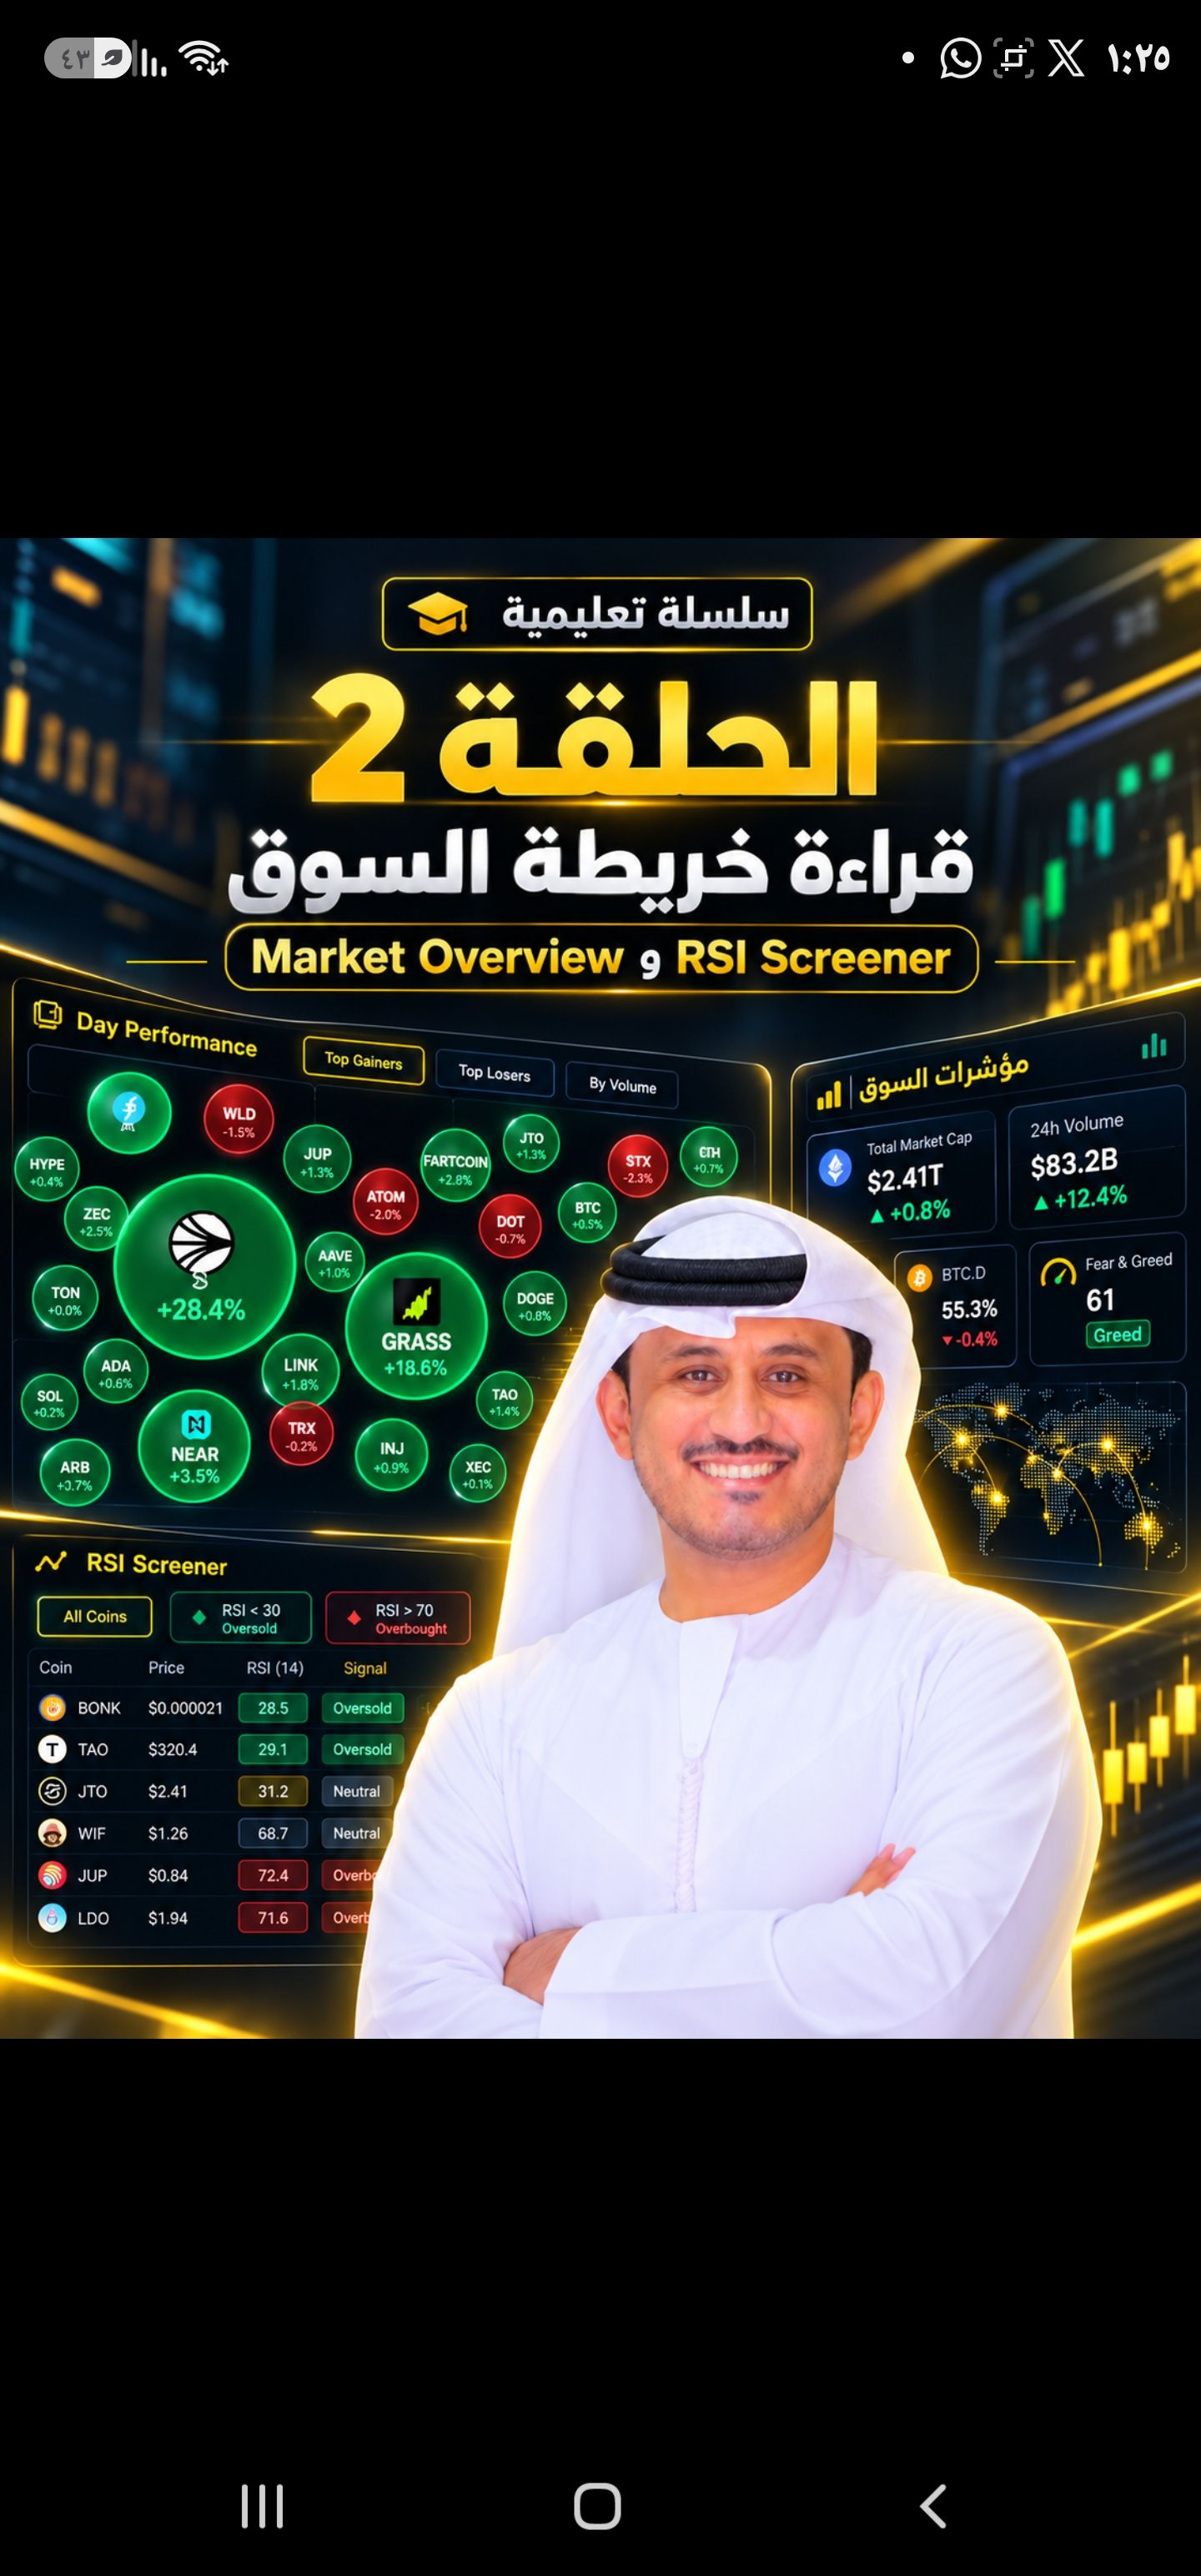

🚀 Episode 1 | Part 2 of 4
Get to know the Chart Beyond Terminal platform
It’s a digital market analysis interface that combines charts with tools for tracking derivatives, liquidity, and market movements.
Through the interface we explored in the video, we can see three key sections:
📍 First: The top bar
Displays the currencies we follow, such as BTC and ETH, along with their prices, percentage changes, and timeframes.
📍 Second: Chart
It helps track price movements, trading levels, and technical indicators added to the chart.
📍 Third: List of Analysis Tools
It contains sections such as Market Overview, Open Interest, Funding, Whale, ETF Flow, and Options.
This is where the platform’s educational value lies: instead of navigating between several pages, traders can view different types of data from a single interface.
However, you should always verify how recent the data is and check its source; the word LIVE does not necessarily mean that all information is updated without delay.
🔗 Platform link:
https://chartbeyond.com/app
In the following image, we explain the function of each tool.