
📊 Episode 1 | Part 1 of 4
Can we understand the cryptocurrency market from the chart alone?
📊 Episode 1 | Part 1 of 4
Can we understand the cryptocurrency market from the chart alone?
Most traders watch candlestick charts and indicators such as RSI, MACD, and moving averages.
These tools help us study trends, momentum, and support and resistance levels, but they don’t reveal everything happening behind price movements.
Imagine that Bitcoin rose by 3% over a few hours.
Is this rise due to new positions being opened, or short positions being closed? And is it accompanied by an increase in open interest?
This is where additional data becomes important:
🔹 Open Interest: Helps us determine whether the number of open positions is increasing or decreasing.
🔹 Funding Rate: Helps us understand the cost of holding perpetual contract positions and how crowded one side of the market is.
🔹 Volume: Shows the amount of trading activity accompanying the price movement.
In summary: Price action tells us what happened, while supporting data helps us understand the context in which it happened—but it doesn’t guarantee what direction the market will move next.
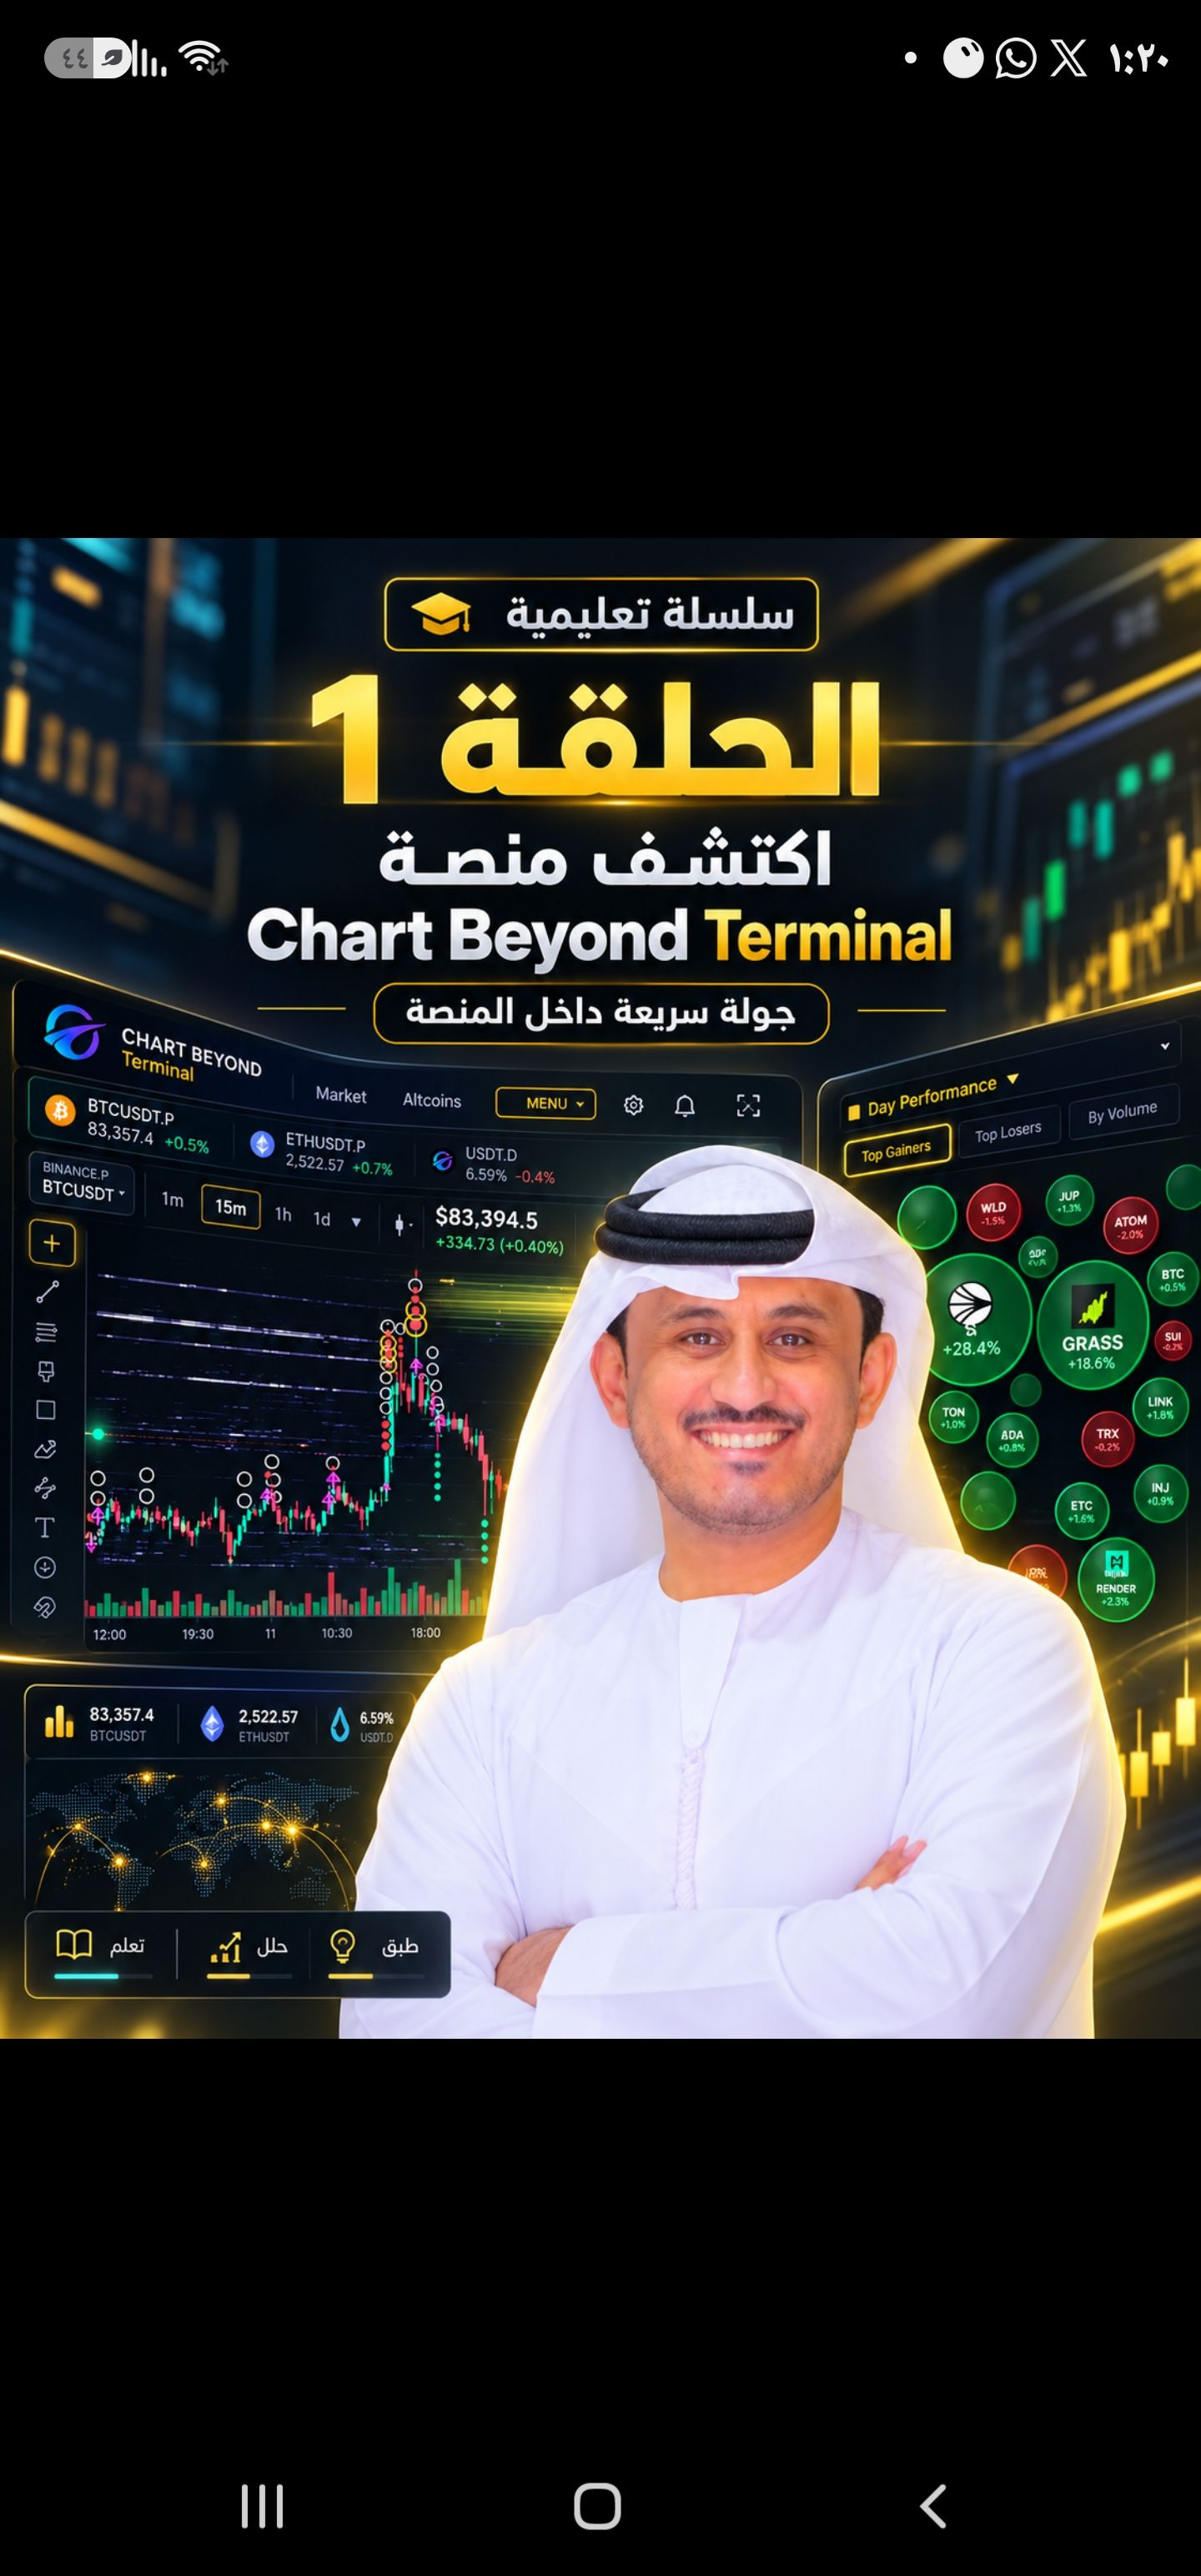
In the following image, we’ll see the platform that brings these tools together, along with Japanese candlesticks and indicators such as RSI, MACD, and moving averages.
These tools help us study trends, momentum, and support and resistance levels, but they don’t reveal everything happening behind price movements.
Imagine that Bitcoin rose by 3% over a few hours.
Is this rise due to new positions being opened, or short positions being closed? And is it accompanied by an increase in open interest?
This is where additional data becomes important:
🔹 Open Interest: Helps us determine whether the number of open positions is increasing or decreasing.
🔹 Funding Rate: Helps us understand the cost of holding perpetual contract positions and how crowded one side of the market is.
🔹 Volume: Shows the amount of trading activity accompanying the price movement.
In summary: Price action tells us what happened, while supporting data helps us understand the context in which it happened—but it doesn’t guarantee what direction the market will move next.
In the following image, we’ll see the platform that brings these tools together.