


Domino’s Pizza stock has a bearish daily setup, despite a positive daily MACD histogram. Price sits below all three daily exponential averages, while hourly indicators reinforce the downside bias. The 15-minute chart offers a limited counterpoint, not a change in the broader outlook.
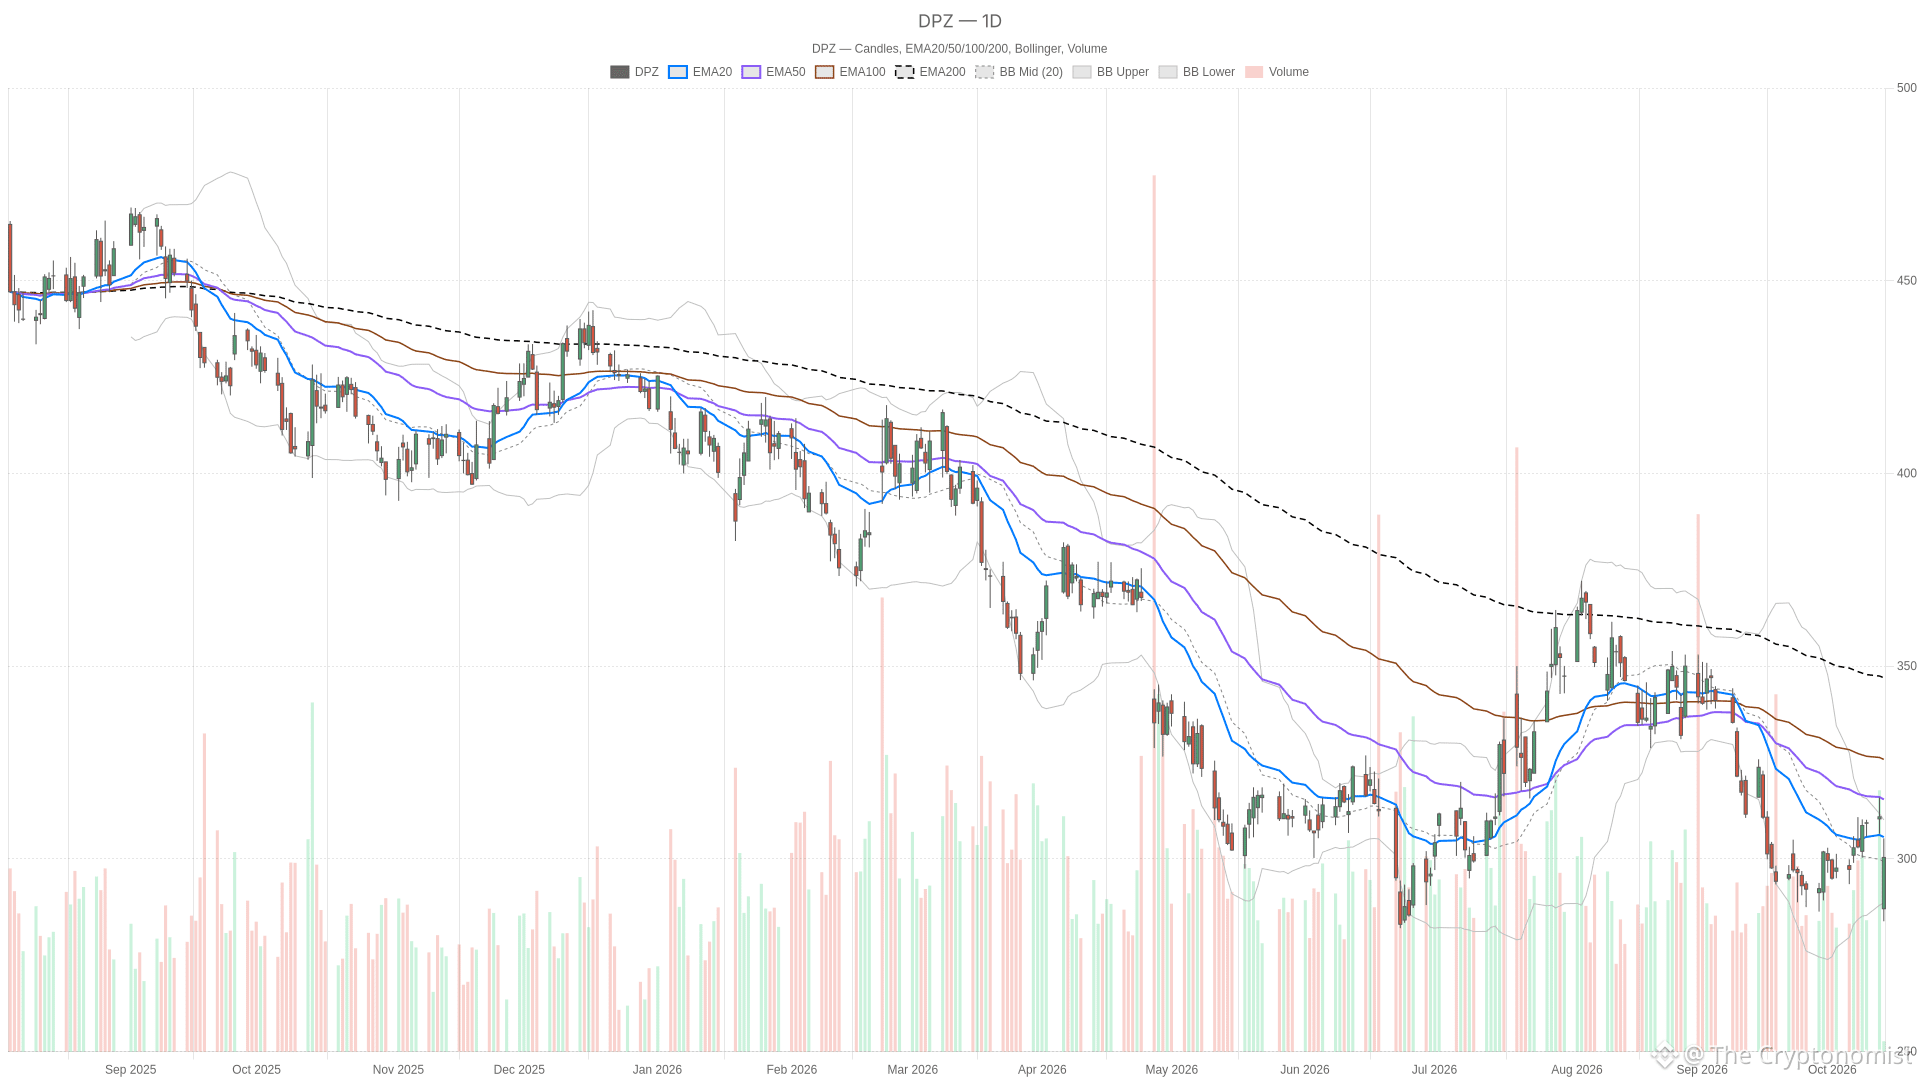 DPZ — daily chart with candlesticks, EMA20/EMA50 and volume.
Key takeaways
DPZ was trading at $300.37 as of 10:32 ET on Tuesday, down 3.39% from the previous close. The session remained open.
Daily RSI14 is at 42.91, below the neutral 50 mark, and down from 51.85 in the prior session.
Price sits below the 20-session EMA at $305.64, the 50-session EMA at $315.43, and the 200-session EMA at $347.54.
The daily MACD histogram is positive at 2.48, though the MACD line at -4.38 remains below zero.
Daily ATR14 rose to $9.91 from $8.59. Hourly RSI14 fell to 38.77 from 55.68.
On Tuesday, October 13, 2026, DPZ opened at $287.05. It traded between a low of $283.81 and a high of $305.32. The stock was trading at $300.37 as of 10:32 ET, down 3.39% from the previous close. DPZ opened at $287.05, traded between a low of $283.81 and a high of $305.32, and was last at $300.37, against a previous close of $310.90.
Earnings coverage frames the session
Seeking Alpha reported before Tuesday’s open that Domino’s Pizza fell after disappointing U.S. same-store sales. Its report also cited revenue growth of 3.4% to $1.19B and earnings per share above estimates. That combination places the sales disappointment alongside positive elements, rather than presenting an entirely negative result.
However, commentary published on Sunday, October 11, offered a different assessment. A Seeking Alpha contributor argued that same-store sales concerns were overblown and rated DPZ a Strong Buy. A Yahoo Finance contributor also argued the stock looked cheap given its strong free cash flow margins. Those are contributor views, not confirmation of a bullish chart.
Domino’s Pizza stock remains below daily averages
Daily trend structure
The daily averages form a bearish alignment. Price is below the 20-session EMA at $305.64. It also sits below the 50-session EMA at $315.43 and the 200-session EMA at $347.54. The nearest average therefore remains above the current price, leaving the daily trend framework unfavorable.
Daily momentum readings
Meanwhile, daily RSI14 fell to 42.91 from 51.85 in the preceding session. It now stands below 50, consistent with the bearish bias. The daily MACD line is -4.38, above its signal at -6.86, with a positive histogram of 2.48. This is the main counterweight: the line remains below zero but above its signal. The histogram is at 2.48.
Daily support and resistance
Price sits above the daily Bollinger mid-band at $299.33, between the lower band at $288.56 and upper band at $310.11. That position prevents a uniformly bearish reading. However, price is below the daily first support, S1, at $306.29 and the daily pivot at $311.11. Daily first resistance, R1, stands at $315.71. These pivot levels come from the previous completed daily candle and apply to the current session.
Notably, daily ATR14 increased to $9.91 from $8.59. That records a larger volatility measure. It makes the session’s low and nearby chart levels important reference points without establishing a direction by itself.
Hourly confirmation, with a short-term exception
The hourly chart supports the daily bearish case. Price is below the 50-hour EMA at $305.03. It also sits below the 20-hour EMA at $307.81 and the 200-hour EMA at $312.37. Their order is mixed rather than fully bearish-aligned. Price also sits below the hourly lower Bollinger band at $302.54 and the hourly pivot at $311.25.
In addition, hourly RSI14 declined to 38.77 from 55.68, placing it below 50. The hourly MACD histogram crossed below zero to -0.76 from 0.03. Its line at 0.96 is below the signal at 1.72, confirming the negative line-to-signal relationship despite both being positive.
In contrast, 15-minute RSI14 rose to 31.75 from 28.33. This places it above the oversold threshold of 30. Yet the MACD line at -2.24 remains below its signal at -0.69, with a histogram of -1.55. Price is above the 15-minute lower Bollinger band at $299.27 and pivot at $298.73. However, it remains below first resistance at $300.51. These are short-term timing references, not evidence that the daily bias has changed.
Bullish and bearish conditions for Domino’s Pizza stock
A bullish case would require clearing the 15-minute first resistance at $300.51. It would then need to reclaim the hourly lower Bollinger band at $302.54. More meaningful daily confirmation would require reclaiming the 20-session EMA at $305.64 and daily S1 at $306.29. Beyond those levels, the daily upper Bollinger band at $310.11 and pivot at $311.11 would be further tests.
Conversely, a break below the daily Bollinger mid-band at $299.33 would undermine that bullish case. The 15-minute pivot at $298.73 and first support at $297.54 would then provide nearer-term reference levels. The daily lower band at $288.56 and session low at $283.81 define the deeper downside scenario.
Overall, Domino’s Pizza stock stands above its daily Bollinger midpoint but below its daily averages and pivot-based support. Daily ATR14 is $9.91, up from $8.59, while hourly signals favor the bearish case. Whether the positive daily MACD spread and improved 15-minute RSI can support a reclaim of overhead levels remains unresolved.
FAQ
What are the key support and resistance levels for Domino’s Pizza stock?
On the daily chart, S1 support sits at $306.29, the pivot at $311.11, and R1 resistance at $315.71. The daily Bollinger bands place support at the lower band of $288.56 and resistance at the upper band of $310.11, with the mid-band at $299.33.
What does the daily MACD indicate for DPZ?
The daily MACD line is at -4.38, above its signal line at -6.86, producing a positive histogram of 2.48. The MACD line remains below zero despite being above its signal.
How are the hourly indicators positioned for DPZ?
Hourly RSI14 is at 38.77, below 50 and down from 55.68. The hourly MACD histogram crossed below zero to -0.76 from 0.03. Price sits below the 50-hour EMA at $305.03, the 20-hour EMA at $307.81, and the 200-hour EMA at $312.37.
What did recent contributor commentary say about Domino’s Pizza?
A Seeking Alpha contributor published on Sunday argued that same-store sales concerns were overblown and rated DPZ a Strong Buy. Separately, a Yahoo Finance contributor argued the stock looked cheap given its strong free cash flow margins. Those are contributor views. Seeking Alpha also reported before Tuesday’s open that DPZ fell after disappointing U.S. same-store sales, while noting revenue growth of 3.4% to $1.19B and EPS above estimates.
Disclaimer: This article is for informational purposes only and does not constitute financial advice, an investment recommendation, or a solicitation to buy or sell any financial instrument. The analysis provided is not indicative of future results. Investing in financial markets carries a high risk of capital loss. Always do your own research (DYOR) and consult a qualified financial advisor before making any decision.
Cryptonomist and the author hold no positions in the financial instruments mentioned and receive no compensation from the companies covered.
Article produced with the assistance of artificial intelligence and reviewed by the editorial team.