$BTW
I. Price Structure: A One-Way Surge, with No Clear Top in Sight
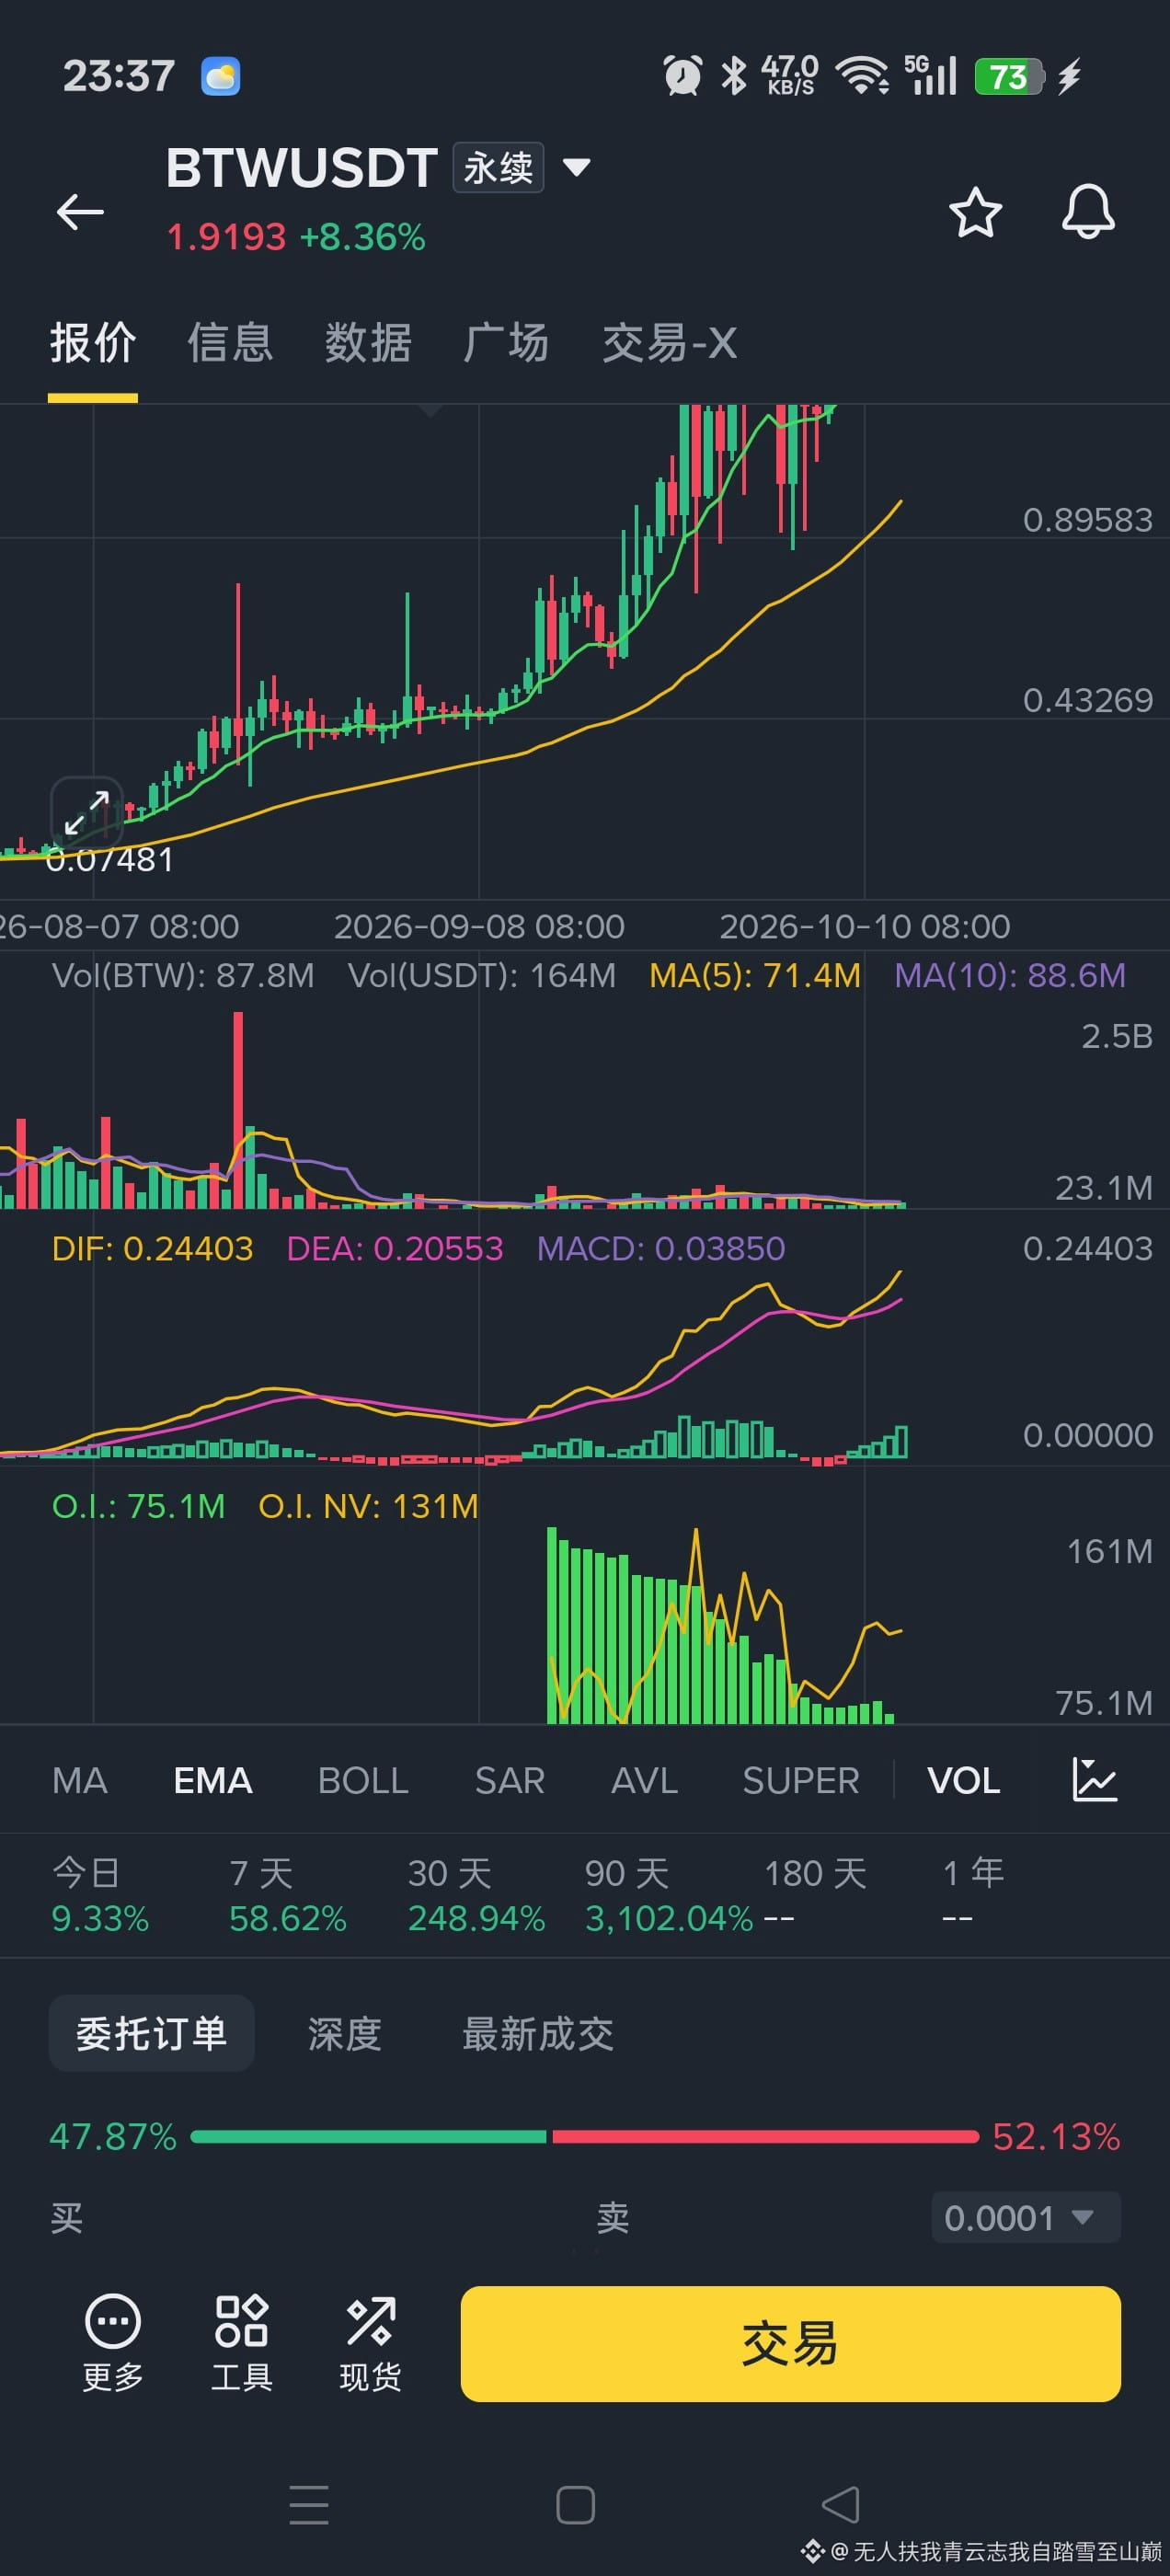
The price climbed from 0.07481 to 1.9193, gaining 3,102% in 90 days and 248% in 30 days. This is an independent rally driven by strong capital inflows, with little correlation to the broader market.
Recently, the price has moved sideways at elevated levels. The candlesticks have repeatedly held above the green moving average (probably around EMA20), indicating support at these highs rather than an outright collapse.
The yellow moving average (a longer-term average, possibly EMA50/60) continues to slope upward and has spread far from the price. This indicates excessive divergence, which could be corrected at any time through a sharp drop or an extended period of sideways trading.
II. MACD: The Bulls Are Still in Control, but Momentum Is Not Explosive
DIF 0.24403 > DEA 0.20553, with a MACD histogram bar of 0.03850. The bullish structure remains intact.
However, note that the histogram bars have reappeared at elevated levels. This is a second rally at the highs, not a move starting from the bottom. If volume fails to keep pace, this pattern can easily develop into bearish divergence at the highs.
III. Trading Volume and Open Interest: The Most Concerning Signals
Earlier, there was an extremely large red volume bar (around 2.5B), typical of heavy-volume distribution or a surge in volume from position turnover. Trading volume has since contracted overall, suggesting that relatively little capital was enough to drive the price during the rally, and that the order book is thin.
O.I. is 75.1M and notional value is 131M. Open interest has not increased significantly in tandem with the price at these elevated levels, and even declined for a period. This suggests that fewer new funds are entering the market, with trading increasingly driven by existing participants.