


Peter Brandt has pointed to an unusual detail behind gold’s bull trend, and it challenges a familiar way of reading futures market data. His observation raises an important question: can positioning that looks bearish actually accompany a powerful gold price rally?
The veteran analyst’s message focuses on the relationship between commercial short positions, large speculative long positions, and the beginning of gold’s advance. The attached chart helps explain why treating those positions as an automatic warning could have led to the wrong conclusion.
Peter Brandt Questions A Familiar Gold Price Warning
Brandt wrote that the start of gold’s bull trend coincided with the heaviest commercial shorts and large speculative longs in history. His final comment, “Sure glad I did not fade that,” explains his position clearly.
To fade a move means to trade against it. Brandt is saying that he was pleased he did not oppose the gold rally simply because the positioning data looked extreme.
That distinction matters because his statement is not a direct prediction of an imminent gold price collapse. His observation challenges the assumption that heavy commercial selling and crowded speculative buying must immediately produce a reversal.
Commercial participants often use futures to manage exposure related to their business activities. Gold producers, for example, can sell futures to protect the value of future production. Their short positions therefore do not always represent a straightforward bet that gold prices will fall.
Large speculators generally have a different purpose. Their positions can express expectations about price direction, and substantial long exposure can accompany an established upward trend.
Did anyone else notice that the start of the bull trend in Gold coincided with the heaviest commercial shorts and large spec longs in history? Sure glad I did not fade that https://t.co/miEfV22uVV
— The Factor Report (@PeterLBrandt) October 11, 2026
The Gold Chart Shows Why Extreme Positioning Needed Context
A look at the gold chart shows a monthly futures price history above a Commitment of Traders positioning panel. The lower panel separates small speculators, large speculators, and commercial participants.
The red commercial line moves deeper into negative territory near the marked period around late 2019 and early 2020. The large speculator line is positive around the same period. This is the relationship Brandt draws attention to: substantial commercial shorts existed alongside substantial speculative longs as gold began a stronger advance.
The price panel provides the essential context. Gold had spent several years below its earlier peak after the decline that followed the 2011 rally. The marked period appears near its departure from that extended base.
Gold subsequently traded above the old resistance area, consolidated again, and eventually advanced much further. That sequence demonstrates why extreme positioning alone was insufficient to invalidate the bullish price structure.
Several details help explain the chart:
Commercial shorts can represent hedging activity tied to business exposure.
Large speculative longs can accompany persistent demand during a bull trend.
Positioning becomes more useful when assessed alongside price behavior.
The image supports the broad relationship Brandt describes, although it does not provide enough readable historical values to independently verify his claim about record positioning. Its displayed endpoint is also dated October 30, 2026, so the final plotted quote should be treated as part of the supplied chart snapshot.
Read Also: XRP Price May Not Fall to $1 Again Unless Bitcoin Does This
Gold’s Later Pullback Does Not Undo Brandt’s Earlier Observation
The right side of the chart shows a steep advance followed by a substantial retreat toward the low $4,000 area. This reminds readers that a successful bull trend can still contain painful corrections.
However, that later retreat does not prove that opposing the earlier breakout would have worked. Timing remains central to the interpretation.
A positioning extreme can persist as prices continue higher. A trader who treats it as an immediate sell signal could face an extended move against that position before a correction eventually arrives.
Brandt’s message therefore concerns how the original rally was interpreted. It does not establish that gold must resume its advance immediately, and it does not remove the possibility of further weakness.
Gold Price Consolidation Keeps $4,240 Resistance Important
The supplied short term outlook describes gold trading mainly between $4,000 and $4,200 since late September. Resistance around $4,240 has repeatedly limited progress, so the broader monthly chart needs a separate assessment from this nearer term range.
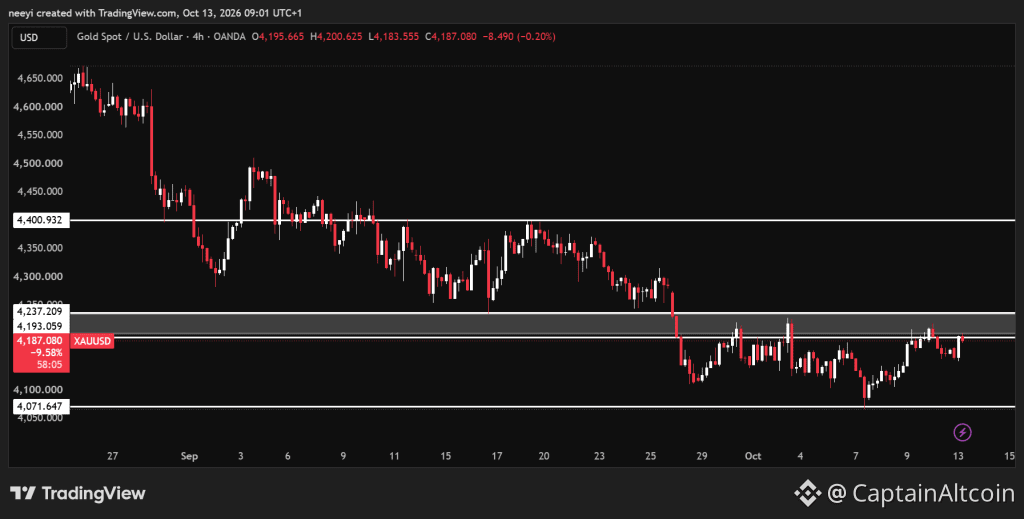 XAUUSD Price Chart / TradingView.com
Gold price consolidation remains the central scenario under that framework. Another rejection near the upper boundary could return the price toward $4,100 and eventually $4,000.
The upside levels require some clarification. A move above $4,200 would bring gold closer to resistance, but a sustained break through $4,240 to $4,250 would provide stronger evidence that the range is opening upward.
The main scenarios are:
A confirmed break above $4,250 could expose $4,300, followed by $4,350 and potentially $4,400.
A rejection near resistance could preserve trading between approximately $4,000 and $4,240.
A break below $4,066 could expose $4,000, with $3,900 becoming relevant if selling continues.
These are conditional paths based on the supplied levels. The monthly chart does not independently confirm every short term boundary.
FAQs
Is gold going to crash in 2026?
Gold is experiencing a sharp market correction and significant price pullback rather than a full structural crash, trading around $4,216 per troy ounce as of October 2026 after peaking near $5,595 in January.
Will gold rise again?
Yes, major financial institutions expect gold to rise again. Analysts at Goldman Sachs Research forecast gold could reach $4,900 per troy ounce by the end of 2026, while J.P. Morgan Global Research projects prices could push toward $6,000 to $6,300 per ounce over the coming year.
Subscribe to our YouTube channel for daily crypto updates, market insights, and expert analysis.
The post Gold Price Sends A Strange Signal, Peter Brandt Warns appeared first on CaptainAltcoin.