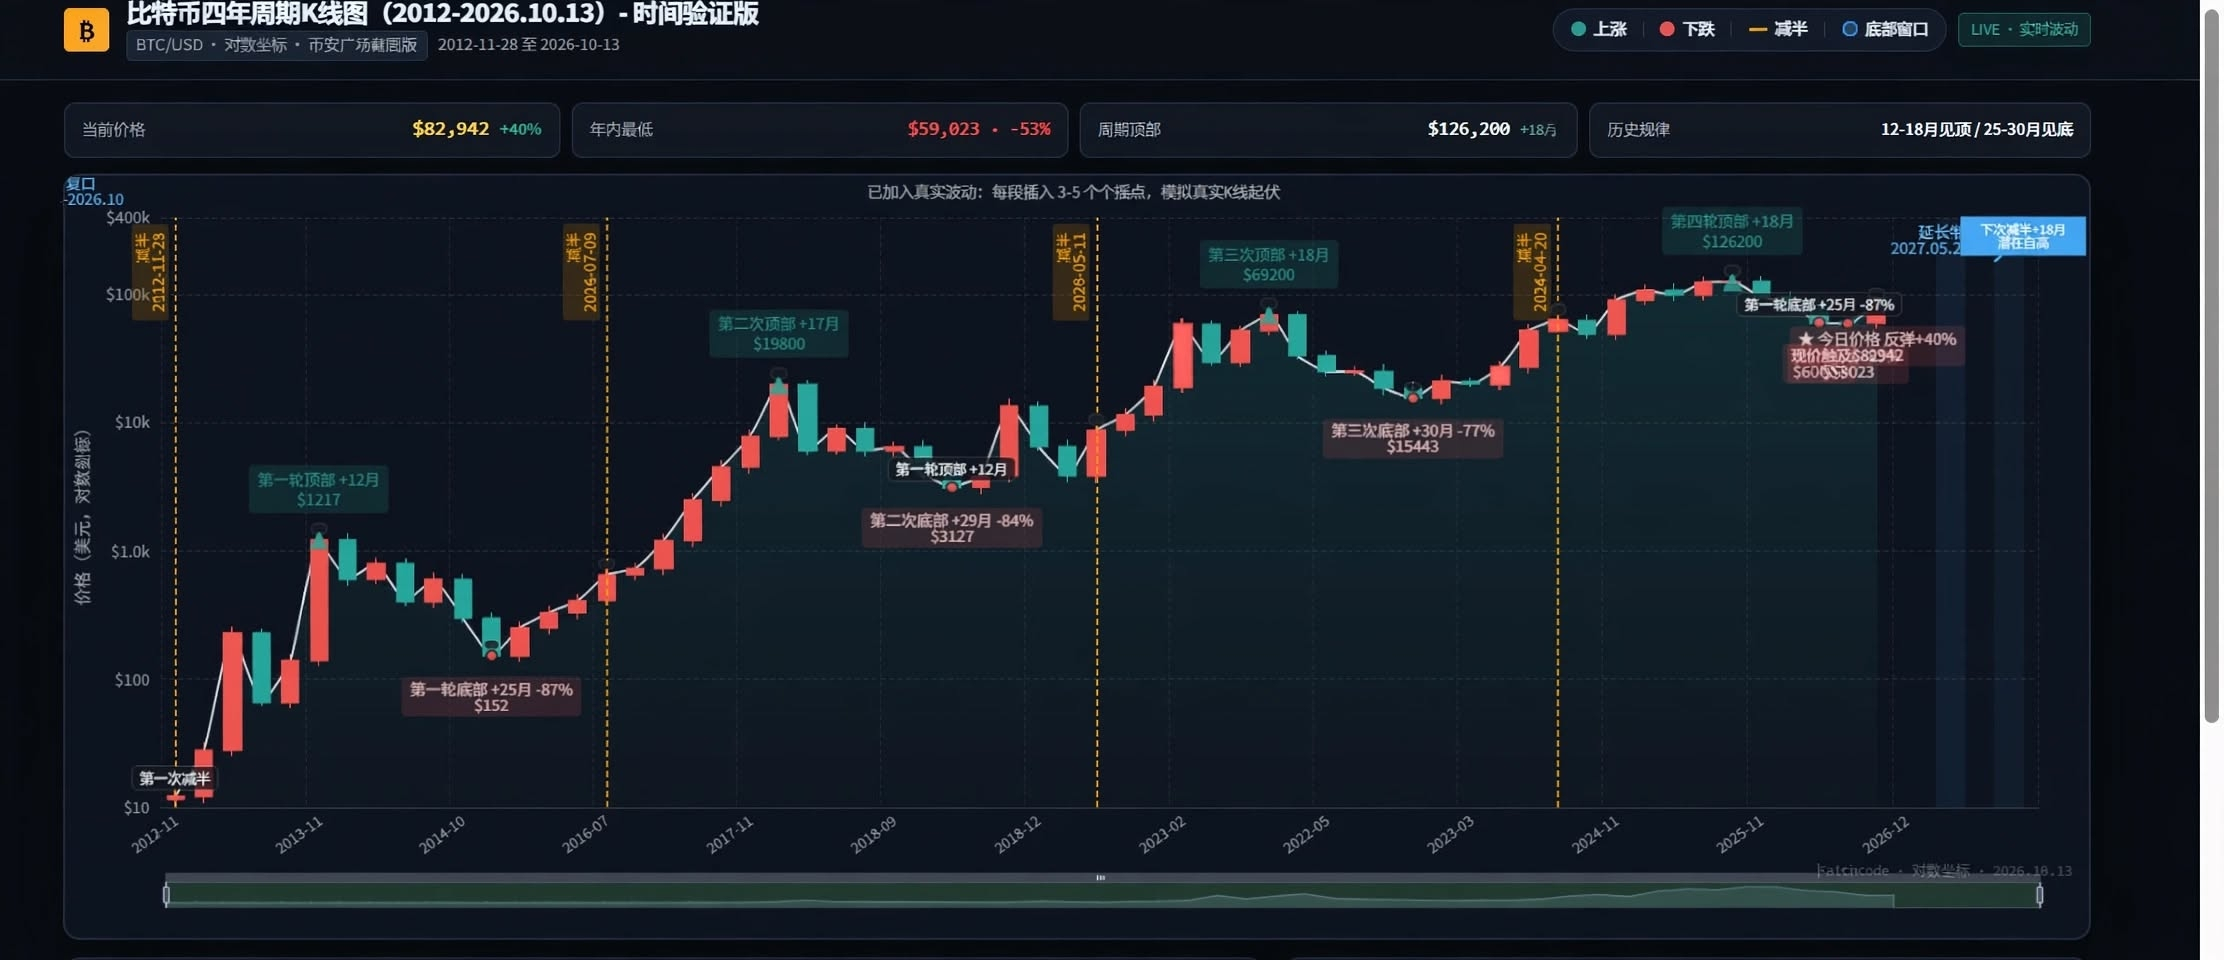
Yesterday’s BTC four-year cycle chart got 2.3k views, but it was too cluttered, so I’ve put together a minimalist version here that focuses only on timing: No price guesses, just time: Bitcoin’s 4 clocks
History doesn’t simply repeat itself; I only track timing.
I’ve organized 4 time windows—purely on a timeline, with no price predictions:
1. Halving to peak: 12–18 months
2012.11 halving → 2013.11 peak: 12 months
2016.07 halving → 2017.12 peak: 17 months
2020.05 halving → 2021.11 peak: 18 months
2024.04 halving → 2025.10 peak: 18 months
2. Halving to bottom: 25–30 months
2012.11 halving → 2015.01 bottom: 25 months
2016.07 halving → 2018.12 bottom: 29 months
2020.05 halving → 2022.11 bottom: 30 months
2024.04 halving → 2026.05–2026.10: watching to see whether it’s a true bottom
3. Peak to bottom: 13–15 months
2013.11 peak → 2015.01 bottom: 15 months
2017.12 peak → 2018.12 bottom: 13 months
2021.11 peak → 2022.11 bottom: 13 months
2025.10 peak → 2026.10–12: to watch
4. Bottom to next halving: 18–19 months
2015.01 bottom → 2016.07 halving: 19 months
2018.12 bottom → 2020.05 halving: 18 months
2022.11 bottom → 2024.04 halving: 18 months
2026.09–10 true or false bottom → expected 2028.03 halving: 18–19 months
Actual low this year: 2026.06 $59,023
I’m not judging whether this is the bottom; time will tell.
*This is only an observation of timing patterns and is not investment advice. #BTC #Bitcoin #FourYearCycle #FaithCode
History doesn’t simply repeat itself; I only track timing.
I’ve organized 4 time windows—purely on a timeline, with no price predictions:
1. Halving to peak: 12–18 months
2012.11 halving → 2013.11 peak: 12 months
2016.07 halving → 2017.12 peak: 17 months
2020.05 halving → 2021.11 peak: 18 months
2024.04 halving → 2025.10 peak: 18 months
2. Halving to bottom: 25–30 months
2012.11 halving → 2015.01 bottom: 25 months
2016.07 halving → 2018.12 bottom: 29 months
2020.05 halving → 2022.11 bottom: 30 months
2024.04 halving → 2026.05–2026.10: watching to see whether it’s a true bottom
3. Peak to bottom: 13–15 months
2013.11 peak → 2015.01 bottom: 15 months
2017.12 peak → 2018.12 bottom: 13 months
2021.11 peak → 2022.11 bottom: 13 months
2025.10 peak → 2026.10–12: to watch
4. Bottom to next halving: 18–19 months
2015.01 bottom → 2016.07 halving: 19 months
2018.12 bottom → 2020.05 halving: 18 months
2022.11 bottom → 2024.04 halving: 18 months
2026.09–10 true or false bottom → expected 2028.03 halving: 18–19 months
Actual low this year: 2026.06 $59,023
I’m not judging whether this is the bottom; time will tell.
*This is only an observation of timing patterns and is not investment advice. #BTC #Bitcoin #FourYearCycle #FaithCode