

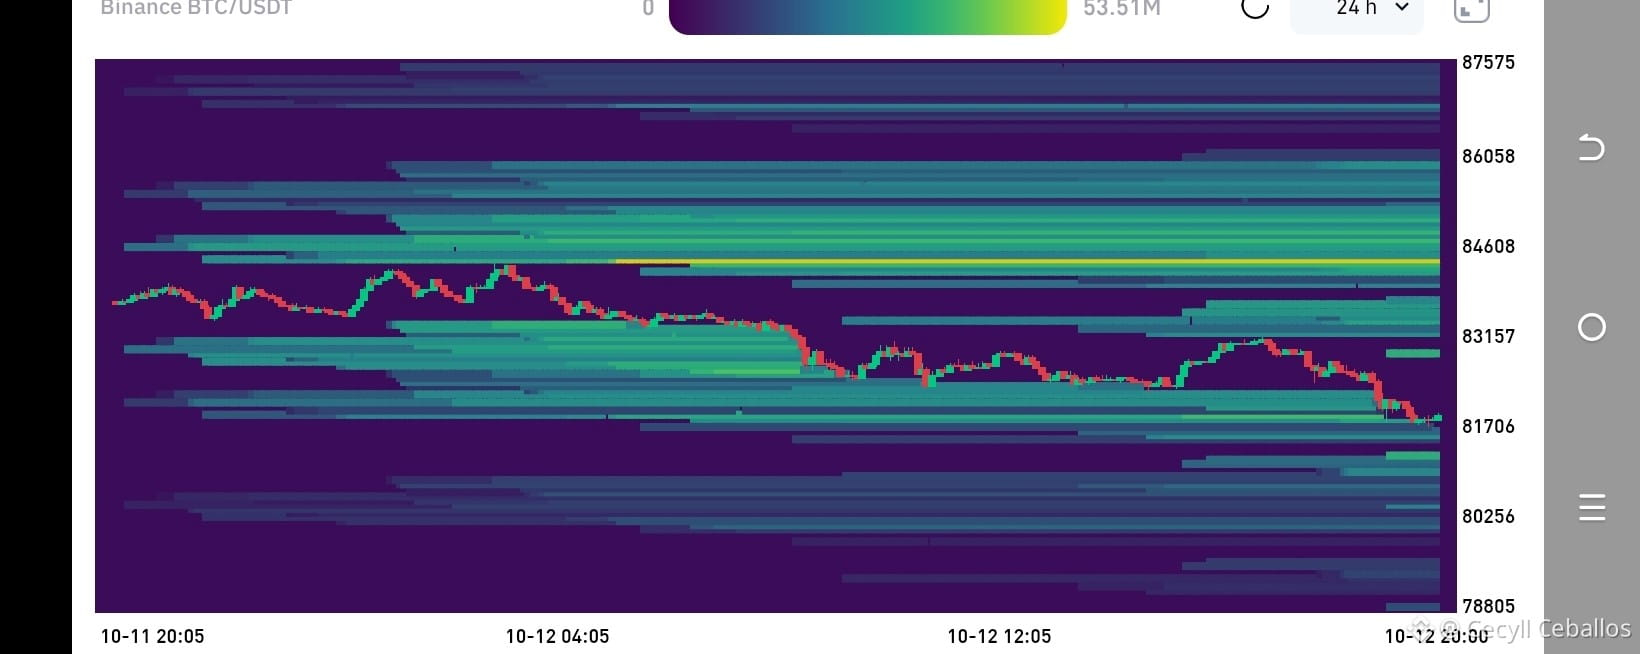

The cryptocurrency market is showing volatility once again, and $BTC is in a crucial battle after losing ground from the $84,000–$85,000 zone, currently trading near $81,800. Below, we analyze the technical factors and liquidity structure behind this move, and what to expect in the coming hours.
📉 Technical Factors: EMA, RSI, and the Cause of the Pullback
Moving Average Dynamics (EMA):
The price has seen a bearish crossover after giving up the EMA 20 and the EMA 50, now acting as immediate dynamic resistance above $82,800 - $83,200.Currently, the asset is seeking support at the EMA 200, a critical trendline that defines the health of the medium-term bias. A sustained break below this level would open the door to a deeper correction.
RSI Oscillator (Relative Strength Index):The RSI is reading in the oversold / low compression zone (around 25–30 points).
This reflects recent downward pressure, but at the same time signals exhaustion in short-term selling, suggesting the possibility of a technical rebound as selling pressure wanes.
Why did this drop happen?Leverage flush and capital outflows: The correction was driven by the cascading liquidation of overleveraged long positions and a temporary pause/outflow of institutional funds from spot ETFs.
Macroeconomic caution: The market remains in wait-and-see and risk-management mode ahead of inflation data (CPI) and monetary policy decisions.
🧲 Liquidity Heatmap: Liquidations, Clusters, and Smart Money
(See the attached Heatmap image)
Sell-Side Cluster Zones:
At the top, a high-liquidity-density band (bright yellow) stands out between $84,200 and $84,600. This cluster represents accumulated sell orders and stop-loss zones for short positions, making it the primary target for liquidity hunters if a rebound occurs.
Support and Absorption Zones:At the bottom, we see compressed liquidity blocks in the $81,200 – $80,500 range. If whales decide to sweep the stops of eager buyers, this zone will act as the key absorption point.
Smart Money and Whale Behavior:Smart Money often takes advantage of these mass capitulation moves to absorb supply from panicked retail traders (shakeout) near deeper liquidity levels before driving a range recovery.
💡 Outlook / Final Verdict
Bullish Scenario (Rebound): To confirm strength, $BTC must defend the current zone ($81,300 - $81,800) and reclaim the short-term EMAs with volume to test the upper cluster at $84,200+.
Bearish Scenario (Caution): Losing support at $80,500 on volume would validate a move to seek lower liquidity levels toward the $78,800.
👍 If you like my analysis, give it a like. Follow me and I’ll follow you!
#BTC #BinanceSquare #CryptoAnalysis #Trading $BNB $SOL #Crypto #Bitcoin #SmartMoney