🗓 CPI Drops Wednesday. Here's the Map for Bitcoin
Last week's scoreboard (Oct 3-9):
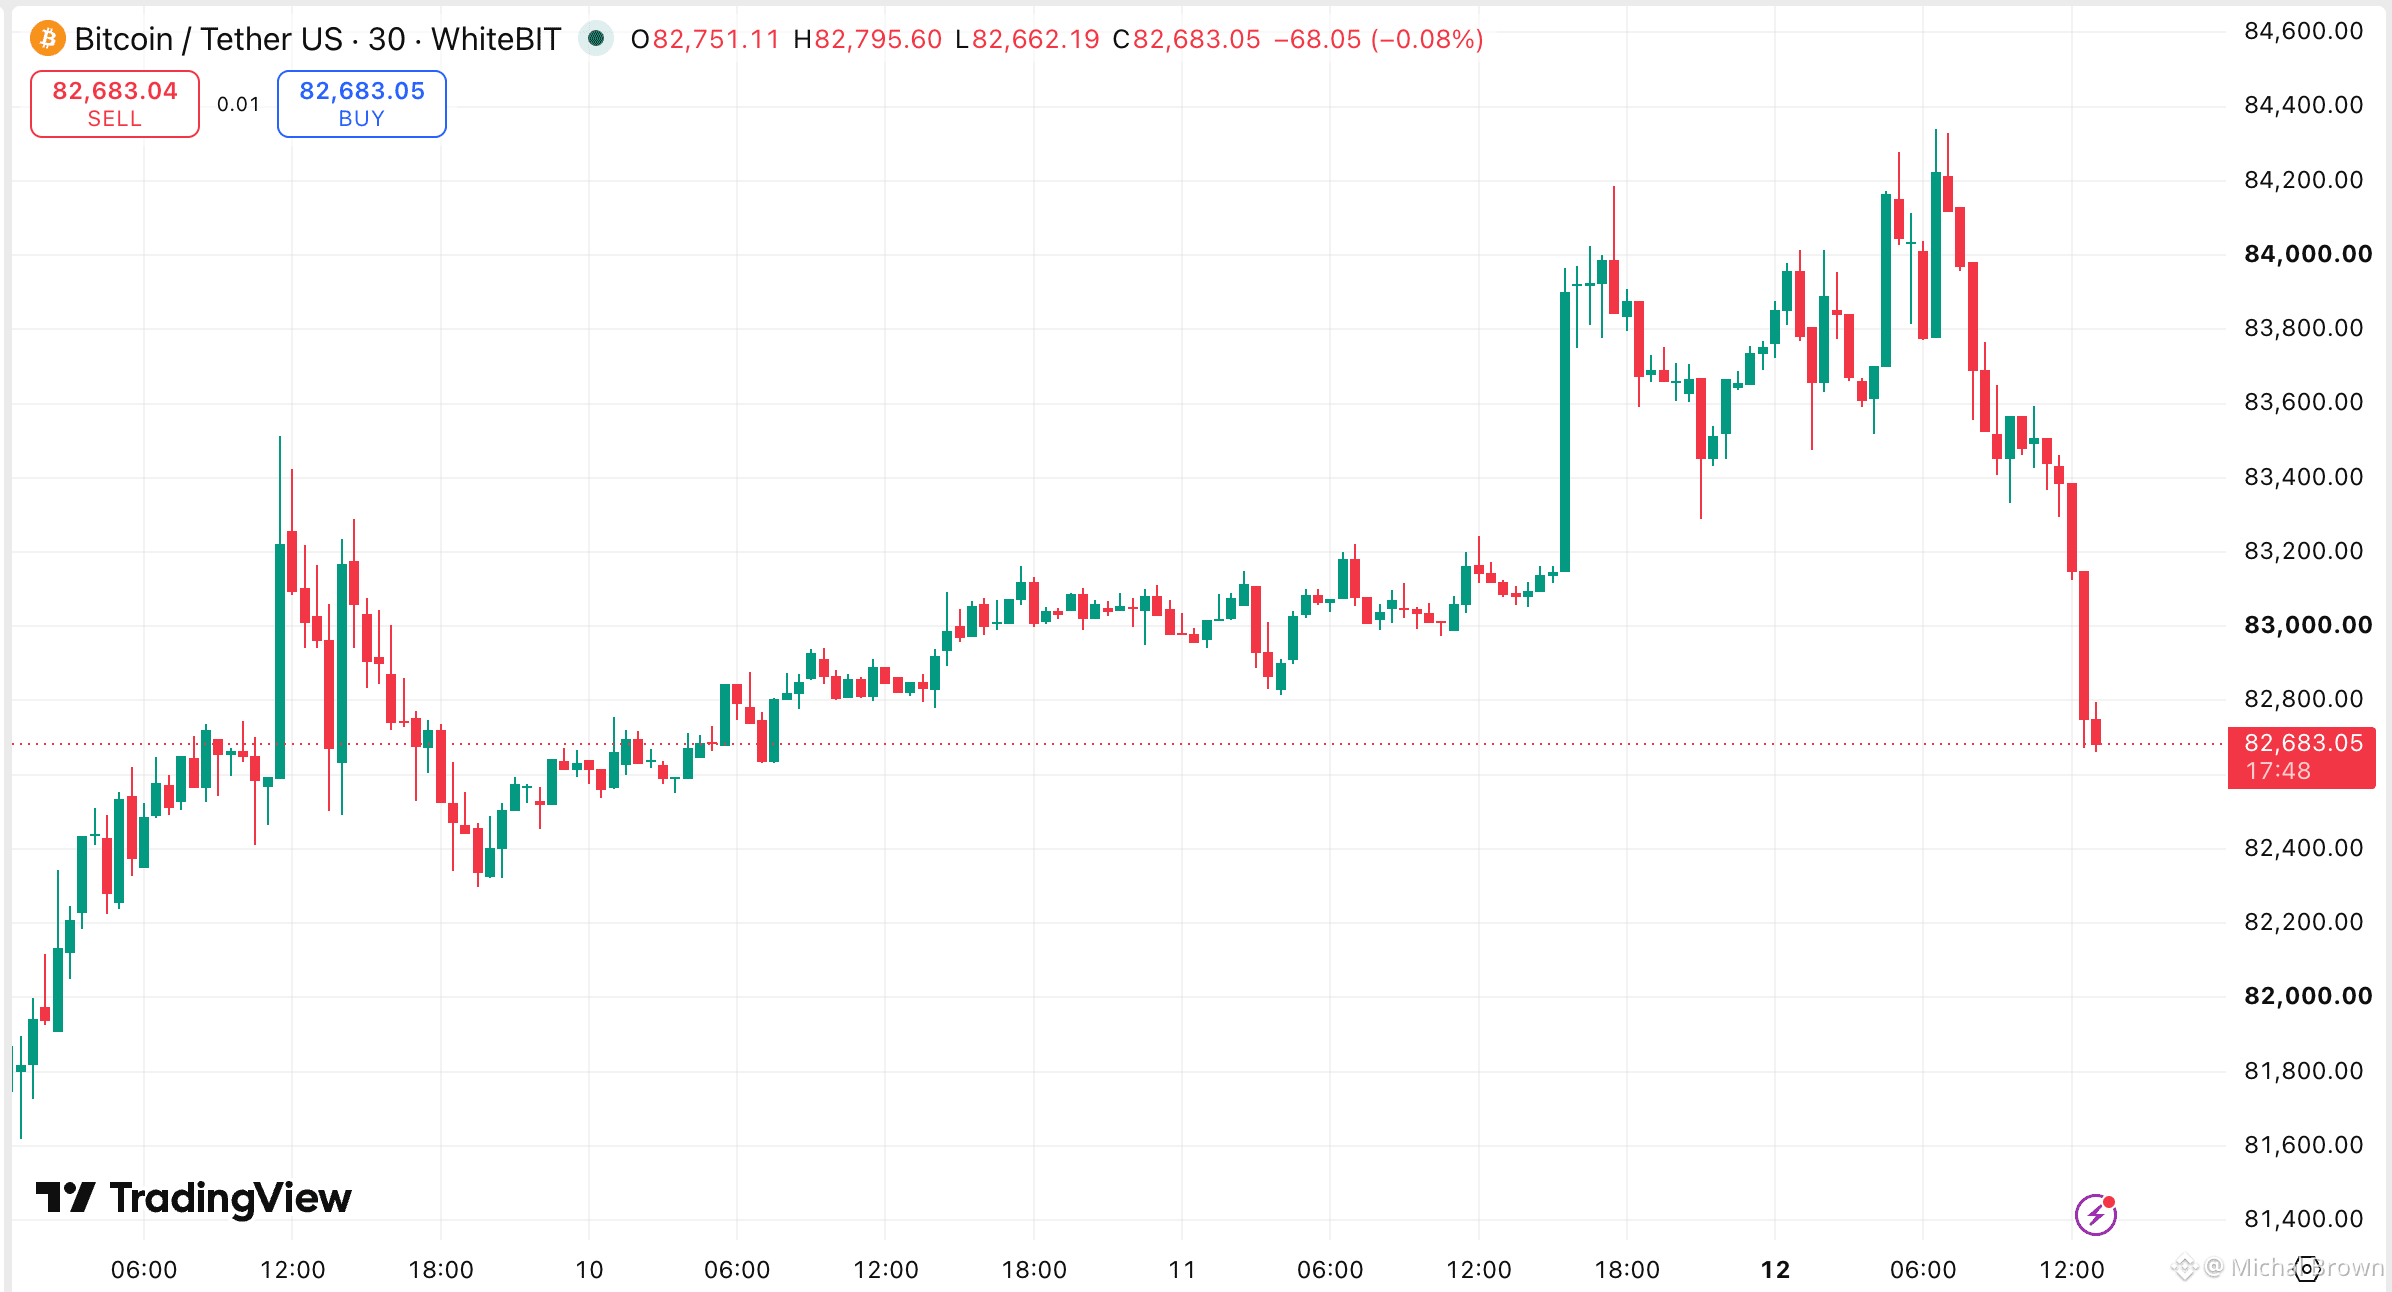
🟠 $BTC → -3.8%, now below $82K
🟣 ETH → -8.4%, more than 2x BTC's drop
🔵 XRP → -7.1%
🦄 UNI → -18.4%, CAKE → -15.9%
🏖 SAND → +57.7% on, as far as anyone can tell, pure speculation 😅
The macro pressure behind it:
📈 10-year yield → above 5.35%, highest since 2002
📈 30-year yield → ~5.7%
🔥 ISM services prices → 74
🛢 Brent → back above $100
September CPI comes out Wednesday, October 14. Expectation: 3.6% year over year, up from 3.4%.
My scenario map:
🔴 3.7%+ → hotter than expected, yields push higher, $BTC risks deeper into the $80K zone
🟡 3.6% → in line, relief is short-lived because the trend is still up
🟢 3.5% or below → first real crack in the yield surge, room for a relief bounce
My take: one CPI print won't fix 5% yields. But a soft one could be the first domino.
Last week's scoreboard (Oct 3-9):
🟠 $BTC → -3.8%, now below $82K
🟣 ETH → -8.4%, more than 2x BTC's drop
🔵 XRP → -7.1%
🦄 UNI → -18.4%, CAKE → -15.9%
🏖 SAND → +57.7% on, as far as anyone can tell, pure speculation 😅
The macro pressure behind it:
📈 10-year yield → above 5.35%, highest since 2002
📈 30-year yield → ~5.7%
🔥 ISM services prices → 74
🛢 Brent → back above $100
September CPI comes out Wednesday, October 14. Expectation: 3.6% year over year, up from 3.4%.
My scenario map:
🔴 3.7%+ → hotter than expected, yields push higher, $BTC risks deeper into the $80K zone
🟡 3.6% → in line, relief is short-lived because the trend is still up
🟢 3.5% or below → first real crack in the yield surge, room for a relief bounce
My take: one CPI print won't fix 5% yields. But a soft one could be the first domino.