



Last week’s analysis warned that Bitcoin (BTC), then trading near $87,000, was likely to correct to around $80,000 before retesting overhead resistance.
Based on this scenario, after the previous rally we reversed direction and opened a short position around $86,000, with a clear target of $80,000.
The market then moved as expected. Bitcoin corrected to $80,000, nearing the 50-day exponential moving average (EMA 50), an important technical indicator in the current structure.
Once the target price was reached, I closed my entire short position to lock in profits and used the same price level as an opportunity to increase my spot Bitcoin holdings.
What can we expect from Bitcoin now?
The base case remains bullish. Despite the recent correction, the daily chart shows that Bitcoin is maintaining its uptrend structure.
The likelihood that Bitcoin will make another attempt to break through the $87,000–$88,000 resistance zone is considered quite high.
If Bitcoin breaks above this range and holds above it, the next target range to watch is $92,000–$94,000.
The key factor will be the balance of supply and demand when prices return to the $86,000–$89,000 range. This time, it will be important to see whether accumulation and buying demand come in instead of distribution, turning former resistance into support—a ‘resistance-to-support’ flip.
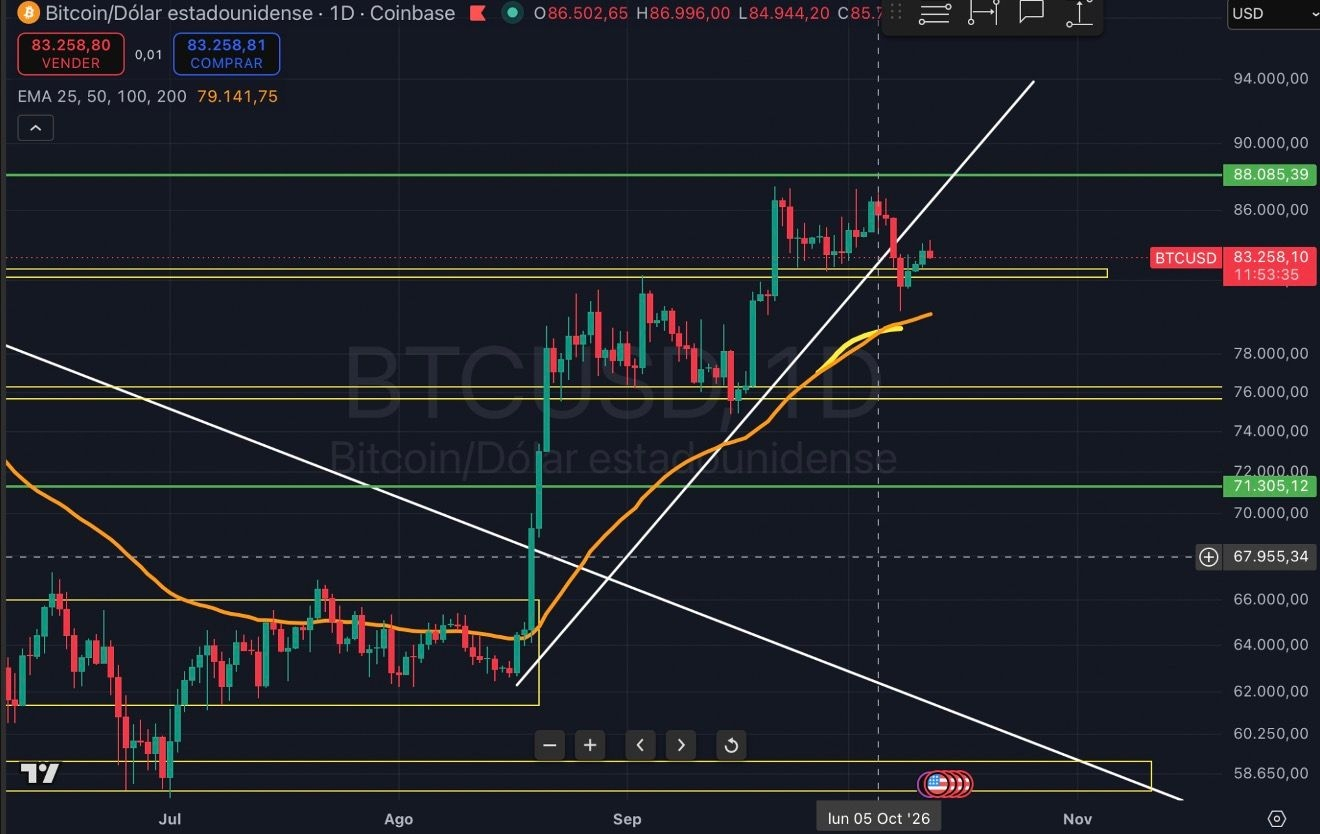
BTC/USD daily chart (TradingView; chart provided).
Read also: GPT-6.1 Sol helped cut Asana agent costs by 76x, but there’s a ‘catch’
What do Bitcoin ETF fund flows tell us?
Fund flows into and out of Bitcoin ETFs are another factor worth watching. Net inflows were recorded across several trading days in late September, but substantial net outflows also occurred in October.
Notably, net outflows of approximately $484.9 million and $244.1 million were recorded on October 7 and 8, respectively.
This suggests that institutional demand has yet to remain consistent and that some selling pressure persists in the market. However, rather than concluding that the trend is about to reverse based solely on two days of large net outflows, it is important to assess them alongside Bitcoin’s technical price structure.
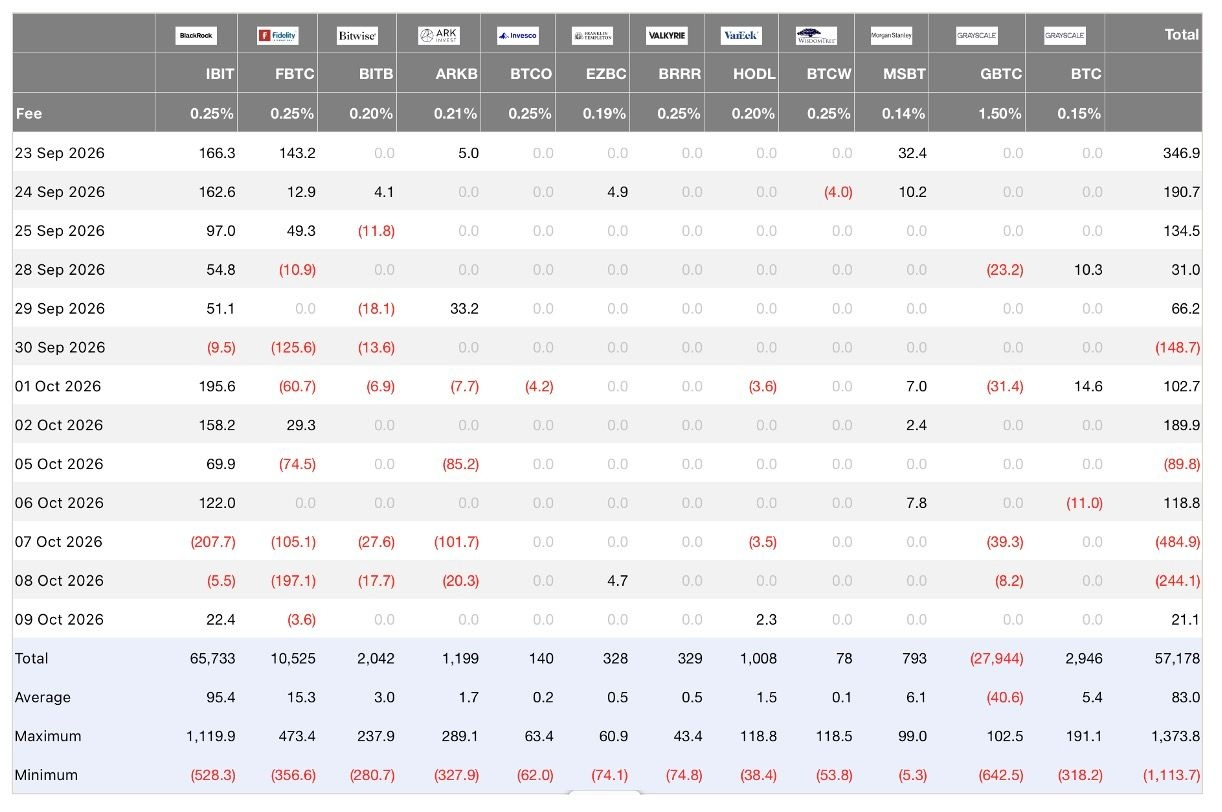
Bitcoin ETF fund flows (in millions of dollars; source data).
Conclusion
The anticipated correction into the $80,000 range has already played out. This decline was used both to close short positions and take profits, and as an opportunity to increase Bitcoin holdings.
The focus has now shifted to the $87,000–$88,000 range. If Bitcoin breaks above this range on strong demand and establishes itself above it, the bullish continuation scenario toward $92,000–$94,000 could gain traction.
For now, the prevailing view is that this decline is a ‘correction phase’ within an uptrend, rather than the start of a new bear market.
Read next: French crypto holders could face fines of up to €10,000 for undeclared wallets