



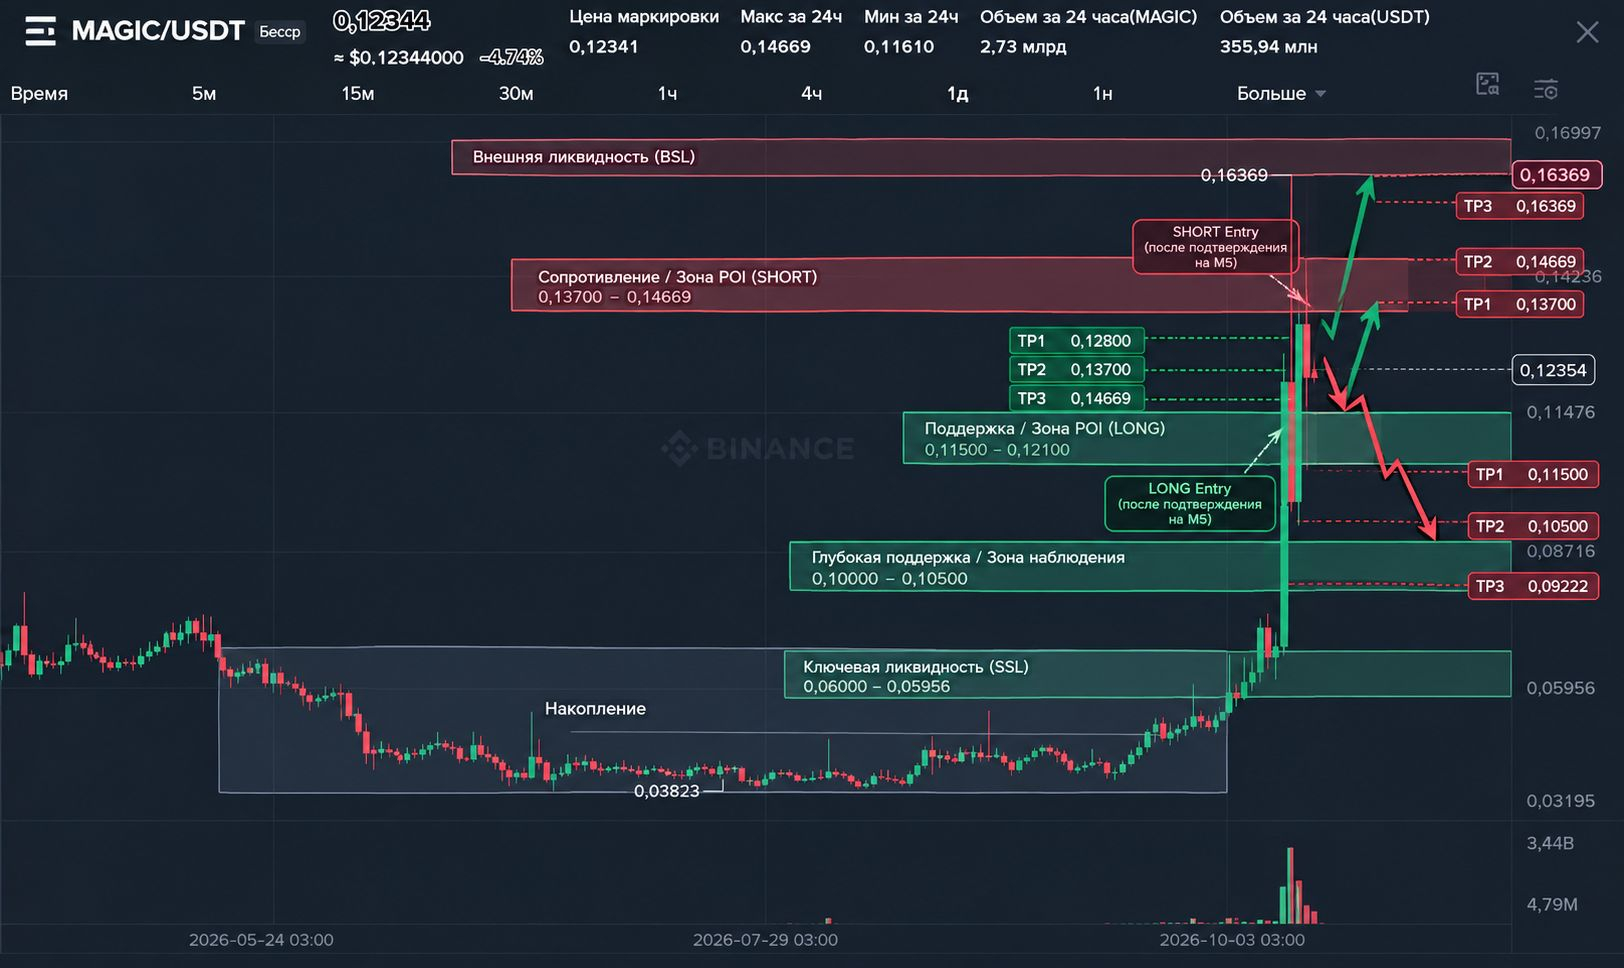
 #MAGIC/USDT $MAGIC/USDT — WEEKLY TRADING PLAN: Can the market continue its rally, or will a deep correction begin?
MAGIC showed strong momentum, rising from $0.03823 to $0.16369. But after the rapid rally, the market ran into sellers, and the price fell back to $0.1235. Next week will show whether buyers can regain control or whether momentum will give way to a deeper correction.
The main goal is not to try to guess the next candle, but to identify which liquidity the market has already taken, where a reaction is forming, and where the next Delivery may head.
This plan considers two scenarios: recovery toward upper liquidity and continuation of the correction toward lower levels. However, the point of interest (POI) is not an entry point: a trade is considered only after the structure is confirmed on M5.
1. HTF Narrative — the story of price movement
The higher-timeframe MAGIC/USDT chart shown displays a prolonged downtrend from the all-time high near $1.58110. After an extended decline, price formed a base around $0.03823–0.06000, where the movement gradually shifted from a prolonged drop to accumulation and then an impulsive expansion.
The market then moved out of the base, accelerated upward, and reached $0.16369. The rise was accompanied by a sharp increase in volume. However, after reaching the high, a strong reaction from sellers followed.
Narrative A → B: accumulation around $0.03823–0.06000 → bullish impulse → liquidity sweep above → reaction from $0.16369 → correction → recovery attempt, which has not yet confirmed a sustained continuation upward.
What has the market already done?
$0.03823–0.06000: formed a prolonged base before the impulse.
$0.06000–0.10000: accelerated upward and moved out of the previous consolidation area.
$0.10000–0.16369: formed a powerful impulsive Delivery.
$0.16369: reached the high of the move under consideration, followed by a strong pullback.
$0.10000–0.14669: formed a broad post-impulse range, with a recovery and a renewed reaction from sellers.
Around $0.1235: price has returned to the midpoint of the trading range, where there is currently no clear entry advantage without additional confirmation.
Where is the current Delivery coming from?
In the nearest stretch, price saw a bearish reaction from the $0.137–0.14669 area and returned to $0.1235. Therefore, short-term pressure remains downward until buyers restore the structure.
Where is the next expected Delivery headed?
There are two options:
Bullish: holds $0.115–0.121, sweeps local SSL, forms a bullish MSS, and moves toward $0.128–0.130, then $0.137–0.14669.
Bearish: loss of support at $0.115–0.11610, confirmation of a downward structure, and delivery to $0.105–0.10076. If selling intensifies further, $0.09222 may become the next target.
These are scenarios that must be confirmed by price action, not forecasts with guaranteed outcomes.
2. Weekly Bias — which scenario takes priority?
Current Bias: neutral with conditional bullish potential.
The powerful rise changed short-term dynamics, but it is not sufficient grounds to declare a long-term reversal. After reaching $0.16369, the market formed a corrective move, and price is currently around the midpoint of the local range.
For decision-making, we use the sequence of timeframes W1 → D1 → H4 → H1 → M15 → M5.
W1 — weekly context
Historically, price went through a prolonged downtrend and formed a low base around $0.03823. The subsequent impulse looks significant, but further development of highs and lows is needed to confirm a change in the long-term structure.
D1 — daily structure
The rise from the base to $0.16369 was accompanied by a sharp expansion in candle ranges and volume. After that, the market failed to hold the high and entered a correction.
The key task is to determine whether the current decline is a correction within a new bullish move or the beginning of a deeper distribution after the impulse.
H4 — trading range
For the current analysis, we use the $0.10076–0.14669 range. The upper part is associated with the supply area and local highs, while the lower part is associated with support and potential seller liquidity.
H1 — nearest structure
After recovering from the area around $0.100, price rose to $0.137–0.14669 but failed to hold those levels. The renewed downward reaction calls for caution when looking for a LONG.
M15 — decision-making zone
The chart provided shows a decline from a local high to $0.121–0.124, followed by stabilization. This area needs to be tested: buyers must demonstrate a genuine structural shift, not just form a few green candles.
M5 — entry trigger
On a lower timeframe, wait for the full sequence:
Liquidity Sweep → MSS → Displacement → FVG/IFVG Retest → Entry.
The trade is not opened until the sequence is confirmed.
3. Key Levels — key price levels
Level
Value
$0.16369
Impulse high and external BSL
$0.14200–0.14669
Upper resistance zone
$0.13700–0.14000
Nearest local liquidity above
$0.12800–0.13000
Intermediate recovery target
$0.12100–0.12400
Current balance area
$0.11500–0.11800
Nearest support
$0.10000–0.10500
Lower area of the trading range
$0.09222
Previous local low
$0.05956–0.06000
Origin of the preceding impulse
$0.03823
Historical low of the base shown
The $0.115–0.121 and $0.137–0.14669 levels are especially important for the near-term trading plan. The reaction in these areas will help determine which scenario has the advantage.
4. Dealing Range — trading range
For the analysis, we use the range:
Range Low: $0.10076.
Range High: $0.14669.
Equilibrium: around $0.12373.
The midpoint of the range is calculated as follows:
[ EQ=\frac{0.10076+0.14669}{2}\approx0.12373 ]
At the current price of around $0.1235, MAGIC is trading practically at Equilibrium.
This is an important nuance: the market is not currently at an obviously favorable point to open a position. Buying in the middle of the range may limit the potential reward-to-risk ratio, while selling without confirmation may lead to entering just before a new recovery.
Premium
The area above Equilibrium, approximately $0.1287–0.14669.
Here, we assess the sellers' reaction, the presence of local BSL, and the possibility of a bearish MSS forming.
Discount
Area below Equilibrium, approximately $0.10076–0.118.
Here, we watch for a potential SSL sweep and the emergence of a bullish reaction.
Premium and Discount describe price's position within the selected range; they are not standalone sell or buy signals.
5. Liquidity — what might the market take next?
BSL — liquidity above the highs
Key areas:
$0.137–0.140 — local recovery highs.
$0.142–0.14669 — upper liquidity of the trading range.
$0.16369 — external impulse high.
A BSL sweep in the upper area does not by itself guarantee a decline. For a SHORT, wait for a reaction, a bearish MSS, and a confirmed FVG/IFVG retest.
SSL — liquidity below the lows
Key areas:
$0.121–0.118 — nearest local lows.
$0.115–0.11610 — lower support area.
$0.105–0.10076 — liquidity in the lower part of the trading range.
$0.09222 — the next reference if the correction continues.
If price sweeps SSL around $0.115–0.121 and quickly recovers, this may create conditions for a LONG. If instead the market holds below support and forms a bearish structure, the likelihood of further downward delivery will increase.
6. POI — areas to watch, not entry points
POI #1 — LONG: $0.11500–0.12100
This is the nearest area to watch for a potential bullish reaction.
What needs to be seen:
Price reaches the zone.
Sweeps local SSL.
Forms a bullish MSS on M5.
Shows pronounced Displacement.
Returns to the formed FVG/IFVG.
Provides confirmation to consider an Entry.
If price merely touches the zone and continues falling, there is no basis for a LONG.
POI #2 — SHORT: $0.13700–0.14669
Here, we watch for a potential BSL sweep and the sellers' reaction.
Required sequence:
Price reaches the resistance area.
Sweeps local BSL or shows a confirmed rejection of the level.
Forms a bearish MSS on M5.
Shows downward Displacement.
Returns to the FVG/IFVG.
After confirmation, there is a basis to consider a SHORT.
A rise into this zone does not automatically mean a sell.
POI #3 — deep support: $0.10000–0.10500
A backup area to watch if the nearest support is lost.
Here, a potential LONG is considered only after a confirmed liquidity sweep and structural recovery. If price holds below the zone, assess the likelihood of a continuation toward $0.09222.
POI ≠ Entry. POI shows where to look for a trading opportunity. Entry only appears after a confirmed sequence on M5.
7. FTA / TA — targets for potential Delivery
For a LONG
Stage
Target
Purpose
FTA
$0.12800–0.13000
Nearest obstacle
TP1
$0.13700–0.14000
Local BSL
TP2
$0.14200–0.14669
Upper liquidity of the range
TP3
$0.16369
Impulse high
For a SHORT
Stage
Target
Purpose
FTA
$0.12100–0.11800
Nearest lower liquidity
TP1
$0.11500–0.11610
Support and local lows
TP2
$0.10500–0.10076
Lower part of the range
TP3
$0.09222
Next structural reference
FTA is the first area where price may encounter opposing order flow. When an intermediate target is reached, reassess the structure and the likelihood of the move continuing.
The levels shown are potential scenario targets, not guaranteed profit-taking points for every trade.
8. Plan A — bullish scenario
Idea: the market holds support and resumes Delivery upward.
Activation conditions:
Price reaches the $0.115–0.121 POI.
A local SSL sweep occurs.
A bullish MSS forms on M5.
Upward Displacement follows.
Price retests the FVG/IFVG.
The structure confirms the possibility of entry.
After confirmation, potential Delivery is directed first toward $0.128–0.130, then $0.137–0.140, and finally $0.142–0.14669.
If buyers overcome the liquidity above and the market can hold above resistance, the next external reference will be $0.16369.
Invalidation: for a specific LONG setup, loss of the structural low on which the entry is based. If price breaks support and continues forming a downward structure, the bullish scenario loses strength.
9. Plan B — bearish scenario
Idea: sellers remain in control after the impulse, and price continues its correction.
Activation conditions:
Price reaches the $0.137–0.14669 POI.
A local BSL sweep occurs, or a confirmed rejection of resistance forms.
A bearish MSS appears on M5.
Downward Displacement follows.
Price retests the FVG/IFVG.
A confirmed SHORT opportunity forms.
Potential Delivery is directed toward $0.121–0.118, then $0.115–0.11610. If price breaks and holds below support, the next targets are $0.105–0.10076 and $0.09222.
Invalidation: a recovery in structure upward and a break of the level that invalidates the specific SHORT setup. For a trade, the stop should be placed beyond structural invalidation, not at an arbitrarily chosen distance.
10. Entry, SL, and RR — why waiting matters more right now
At around $0.1235, the market is near the midpoint of the trading range. The charts provided do not offer sufficient grounds to claim that the current M5 sequence is already complete.
Therefore, at the time of analysis:
Entry: not confirmed.
SL: determined only after a specific structural trigger appears.
TP: selected according to the direction of confirmed Delivery and the nearest liquidity levels.
RR: calculated after Entry and SL are determined.
Risk: the acceptable loss per trade is limited in advance.
You cannot justify an entry solely because price has reached a POI. You cannot calculate RR without a specific entry and stop. You should not move the stop farther away just to avoid closing the trade.
If price moves away without a retest, do not chase it. A missed trade is better than an entry without confirmation.
11. Final plan for the week
MAGIC/USDT is in a direction-defining phase following a strong impulse. Further movement depends on whether buyers hold the nearest support or sellers continue the correction.
Key conditions to watch:
$0.115–0.121: look for a potential LONG only after Sweep → MSS → Displacement → FVG/IFVG Retest on M5.
$0.137–0.14669: look for a potential SHORT if BSL is swept and a bearish structure is confirmed.
Below $0.115–0.11610: assess the likelihood of Delivery to $0.105–0.10076.
Above $0.14669: watch whether the market can hold the breakout and head toward $0.16369.
The main thing now is not to predict every candle, but to wait for the market to show its direction.
Your next step
Watch MAGIC's reaction at two key areas: $0.115–0.121 and $0.137–0.14669.
Write in the comments: which scenario do you think is more likely this week — a recovery to $0.14669 or a continuation of the correction to $0.105?
Support your view with a liquidity sweep, MSS, and expected Delivery. The structure—not emotions after a sharp impulse—should determine the trading decision.
$MAGIC $MAGICUSDT #MAGIC #CryptoTrading #TechnicalAnalysis #WeeklyTradingPlan
