

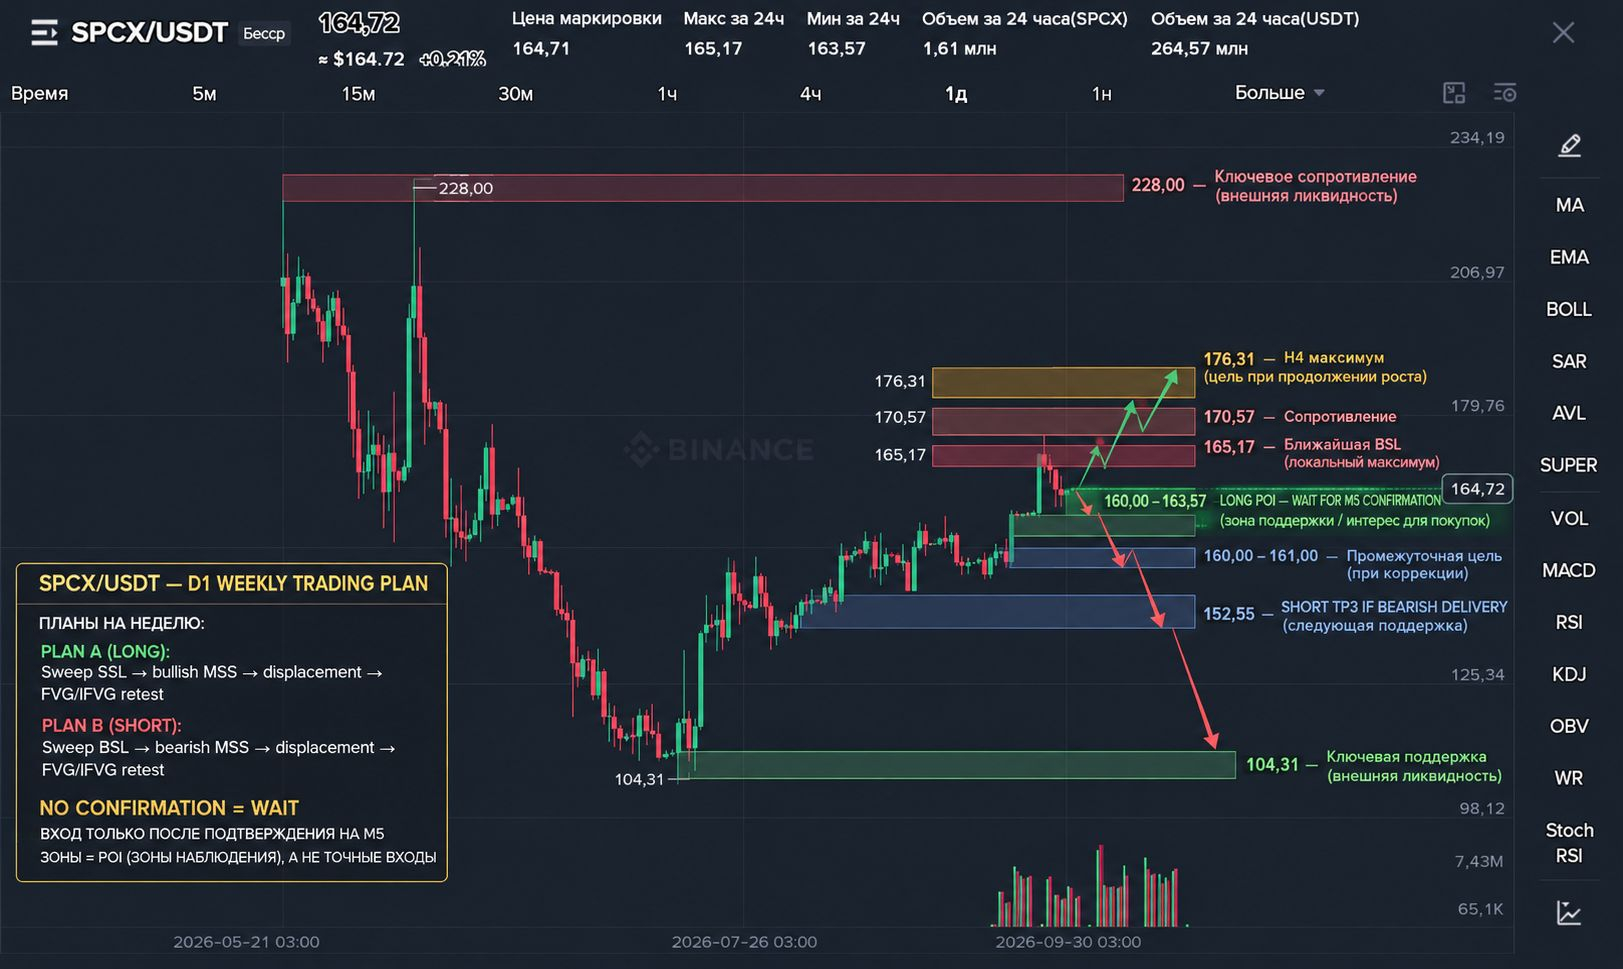
 $SPCX $SPCX/USDT — WEEKLY TRADING PLAN 📊
The market has recovered after the crash. Is SPCX ready for the next Delivery?
SPCX/USDT is trading around 164.7 USDT after a sharp drop from a high of 228.00 to a low of 104.31, followed by a recovery. On lower timeframes, buyers managed to push the price back above the local 160–163 area, but significant resistance lies ahead, and the recovery itself does not yet confirm a full reversal of the higher-timeframe structure.
The main task for the coming week is to determine whether the market will continue delivering upward toward liquidity above the local highs or first return for liquidity below the current consolidation.
We will not guess the direction or chase the impulse. First Narrative, then POI, after that — confirmation on M5.
1. HTF Narrative — higher-timeframe context
W1 → D1: where price came from and what changed
On the provided higher-timeframe chart, a wide trading range is visible: from 104.31 to 228.00. After the high formed, the market showed strong downward Delivery, giving back a significant portion of the previous rise.
Then price formed the 104.31 low and started recovering. This is an important change in market behavior, but two events must be separated:
Fact: after reaching 104.31, price recovered and formed a sequence of local upward moves.
Hypothesis: the recovery may develop into a full bullish continuation.
What is not yet proven: a reversal of the entire higher-timeframe bearish structure.
On the available D1 context, the 104.31–228.00 range remains the key reference for assessing price position. Without a sustained hold above major resistances, the recovery should be viewed as a potential upward correction within a broader range.
H4: local recovery structure
On H4, price rose from the low area, broke through intermediate resistance, and reached 176.31, after which a pullback began.
The current price around 164.7 is below this local high. This means buyers have already shown initiative, but further upward Delivery is not yet confirmed.
For bulls, it is important to hold the area of the latest recovery and push price back above the local highs. For bears, the interest lies in sweeping liquidity above the nearest tops, followed by a confirmed reversal on the lower timeframe.
HTF Bias: neutral-to-bullish within the recovery, but without a confirmed reversal of the higher-timeframe trend.
2. Narrative A → B and Invalidation C
Scenario A → B — the main expectation
A: holding the 160–163 area and restoring buying initiative.
B: a retest of 165.17, then to 170.57–176.31.
Scenario logic: after the upward Delivery from the 104.31 low, the market formed a local recovery structure. If the nearest support holds, the next target may be liquidity above the 165.17 high, and then the more significant supply area at 170.57–176.31.
However, this is a scenario model, not a confirmed buy signal. To execute, we need to see how price interacts with liquidity and the POI.
Invalidation C — invalidation of the main scenario
The main bullish scenario weakens if price loses the 160–163 area and then fails to reclaim it after the retest.
A confident continuation to the downside with a bearish MSS and displacement on H1/H4 will be an argument in favor of a deeper correction.
A single local candle breakout is not enough: the close, structure, and reaction on the return to the level matter.
3. Key Levels — key levels
Level
Value for analysis
228.00
High of the broad range; distant external liquidity
176.31
H4 local high; nearest significant target if growth continues
170.57
Intermediate resistance on the way to 176.31
165.17
Nearest local high; potential BSL
163.57
Locked-in low on the lower timeframe; potential SSL
160–163
Working observation area for holding the recovery
152.55
Lower area of the broad local range; reference point in case of a deeper correction
104.31
Low of the broad range; distant external SSL
The 160–163 and 152.55 levels should be treated as observation zones, not as automatically active entry levels. To confirm a POI, price reaction on the corresponding timeframe must be checked.
4. Dealing Range, Premium / Discount and Price Range
For assessing the broad range, we use the 104.31–228.00 extremes.
Range High: 228.00.
Range Low: 104.31.
EQ, 50% of the range: approximately 166.16.
Current price: around 164.7.
The current price is slightly below the midpoint of the broad range — near Equilibrium, formally in Discount relative to this range.
But there is an important caveat: being in Discount by itself is not a reason to buy. On a shorter range, price may be in Premium, especially after a local impulse to 176.31.
For short-term trading, the 163.57–176.31 range should be assessed separately. Its midpoint is approximately 169.94. At a price of 164.7, the market is in the lower half of this local range.
This creates room for potential recovery, but does not remove the need to wait for structural confirmation.
5. Liquidity — where the likely targets are
Buy-side Liquidity (BSL)
165.17 — the nearest local high.
170.57 — intermediate resistance area.
176.31 — the high of the local upward impulse.
228.00 — far external liquidity of the broad range.
Sell-side Liquidity (SSL)
163.57 — the nearest visible low on the lower timeframe.
160–161 — an area of previous local reactions and support.
152.55 — the next significant lower area of the broad range.
104.31 — the external low of the entire displayed move.
What has the market already swept?
On the provided charts, the 104.31 low is visible, after which price recovered. However, from static images it is impossible to reliably determine which liquidity pools were swept before the last impulse and whether this was accompanied by a confirmed MSS.
On M5, a drop to 163.57 and a subsequent sharp bounce are visible. This may correspond to a local SSL sweep, but it cannot be treated as a confirmed trading signal without checking the candle sequence and structure.
Current Delivery: local recovery after the decline from 176.31.
Next expected Delivery: up to 165.17 and then to 170.57–176.31 if support holds; down to 163.57 and potentially 160–161 if the buying structure is broken.$SPCX