




I. Latest Market Update (October 12, 18:58 Beijing time)
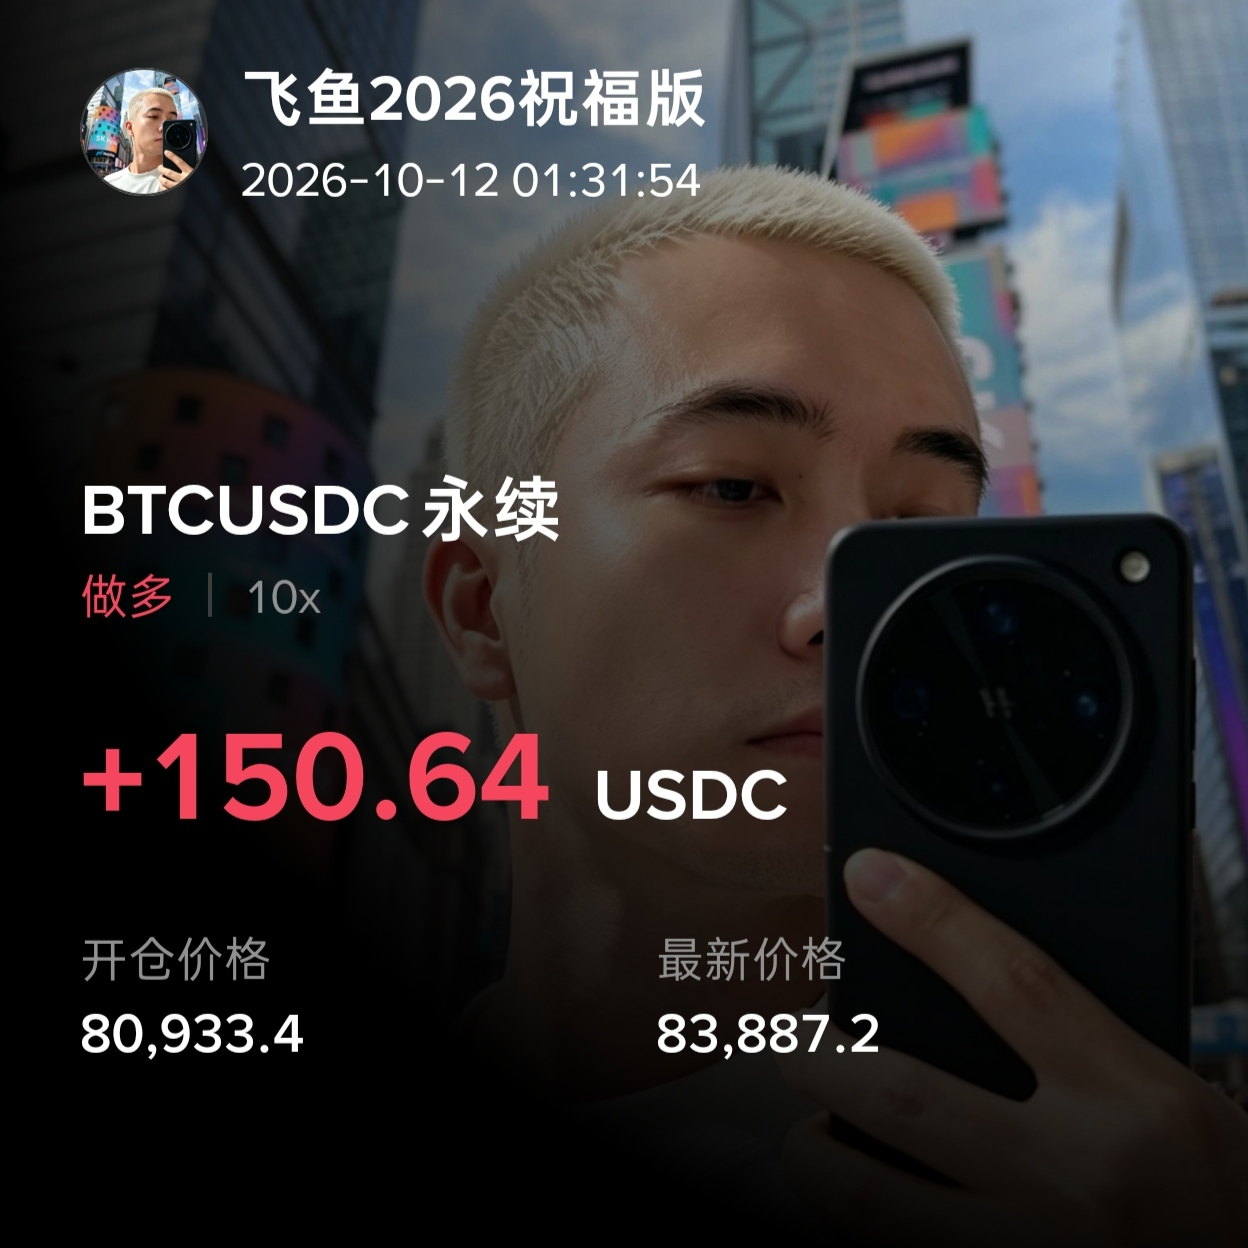
BTC is trading at $83,509. Last Friday, we went live and helped everyone capture a 3,985-point move—a 4.96% gain! After four consecutive bullish daily candles, the price has climbed all the way back from $80,394. Today it hit a high of $84,352, right up against the 20-day moving average (MA20) at $84,129. The 90-day range is $62,275–$87,396, and we’re now at the 85% mark of that range—resistance overhead, and profits all the way down if it falls.$BTC

II. News: Fuel for the bulls, a case for the bears
1️⃣ Saylor is at it again: Strategy bought 334 BTC from October 1–4 at an average price of $85,838. It now holds 848,000 BTC at an average cost of $75,440, and reported $21 billion in Q3 digital asset gains. They’re still buying above $84,000—what are you afraid of?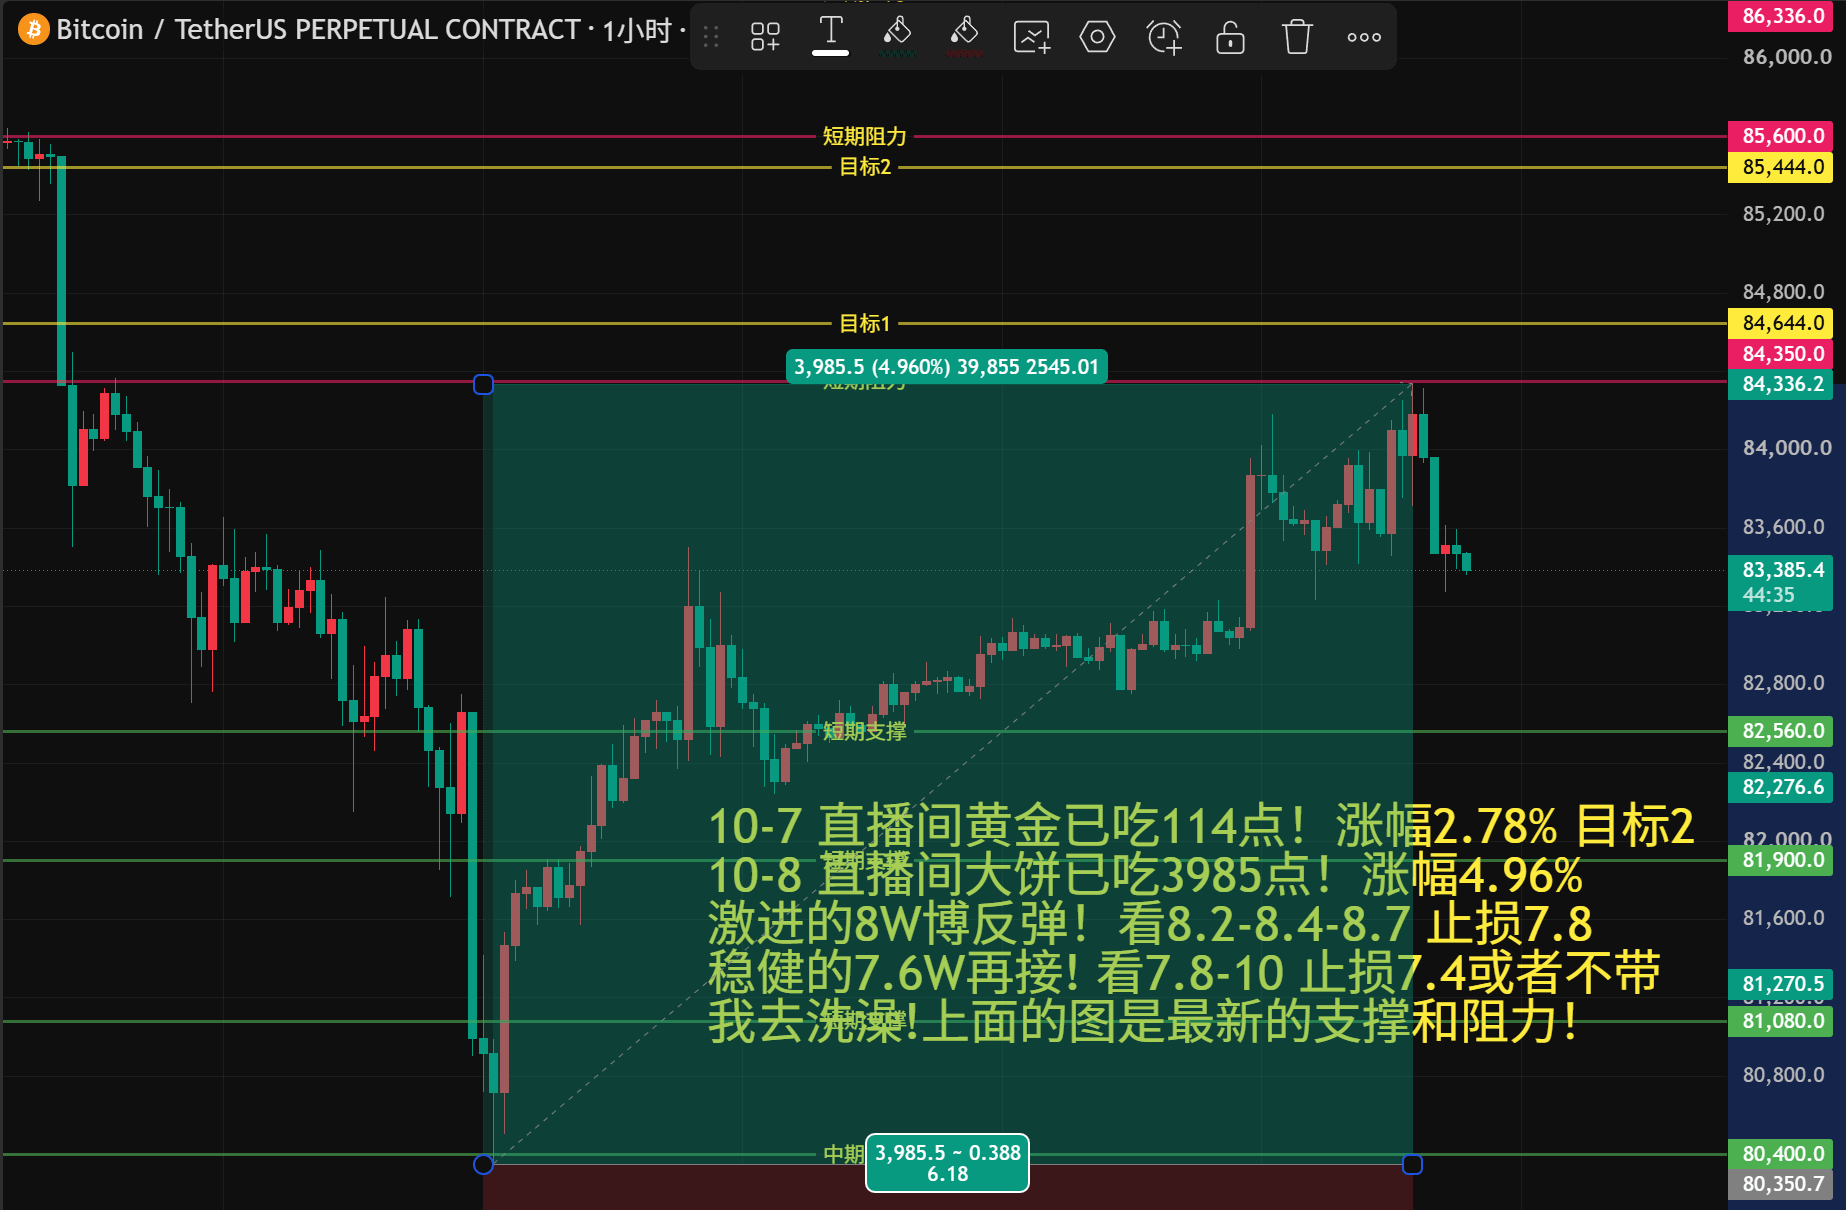
2️⃣ Prediction markets aren't bearish: Polymarket puts the odds of BTC reaching 90,000 before 2027 at 73%, 95,000 at 54%, and 100,000 at 39%; Kalshi's year-end forecast is 86,240.
3️⃣ But the bears have a scenario too: Jiang Zhuoer sees a bottom at 42,000–44,000 in October–December, while Grayscale says the bear market could drag on until September–October next year. The wider the disagreement, the bigger the move.
4️⃣ Macro countdown: CPI is due this Tuesday (October 14) at 8:30 p.m., with expectations at 3.7%; the FOMC meeting is on October 28. The 10-year Treasury yield at 5.17% is weighing on valuations, and gold broke 4,200 tonight—the safe-haven mood hasn't faded.
Three. Technicals: A Crossroads After Four Consecutive Bullish Candles
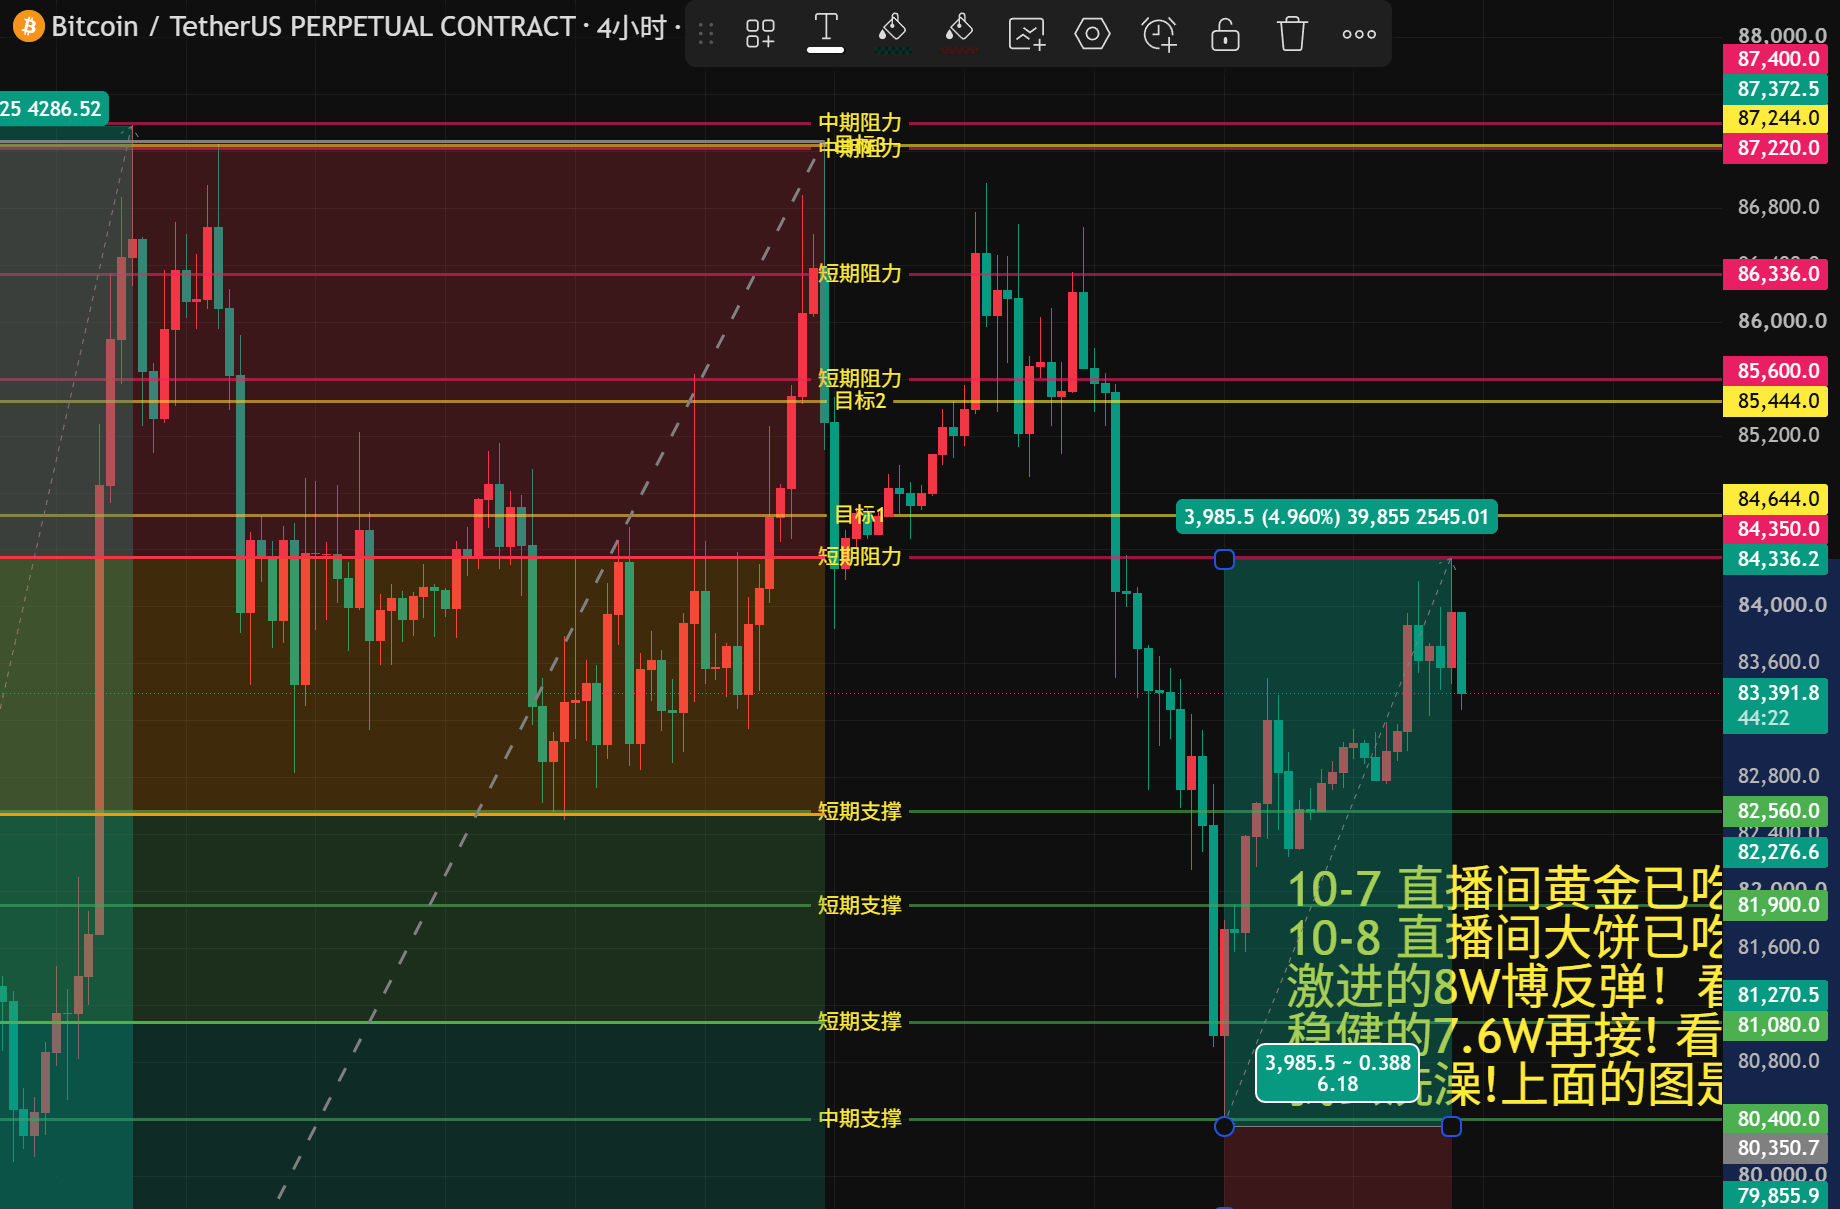
The MA50 (81,080) has successfully held as support, and price has moved back above the Bollinger midline. But the MA20 (84,129) and today's high (84,352) are creating a double layer of resistance. Four consecutive bullish candles on declining volume signal a recovery, not a reversal. The bulls won't have regained the initiative until price breaks above 84,350.
Four. Key Levels at a Glance
📍 Short-term support: 82,560 (previous low turned support) / 81,900 / 81,080 (MA50)
📍 Medium-term support: 80,400 (low of the current pullback) / 76,900 / 76,100
📍 Short-term resistance: 84,350 (MA20 + today's high) / 85,600 / 86,336 (upper Bollinger Band)
📍 Medium-term resistance: 87,220 / 87,400 (90-day double top) / 90,000 (psychological level + prediction markets' first target)
Six. Entry Plan
🟢 Medium to long term (trade time for room to grow): Enter the first tranche at 76,260 and the second at 74,830; exit if price breaks below 71,900. Reassess once the price target above 87,400 is reached. This is near the lower edge of the midpoint of the 90-day range, with an estimated win rate of around 70%—but you may have to wait.
Seven. To put it plainly
The current setup is clear: gains are capped by the double top at 87,400, while the moving averages at 81,000 provide support on the downside. The $2,000 range in between is a hunting ground. Don't gamble on direction in a choppy market; let price choose a side, and we'll get in once it does. CPI is due Tuesday evening, so keep your position size light and sleep a little easier. $BTC