



#LINK🔥🔥🔥 🚨 $LINK/USDT: The market has recovered, but can the price take the next liquidity pool?
Current price: 13.34 USDT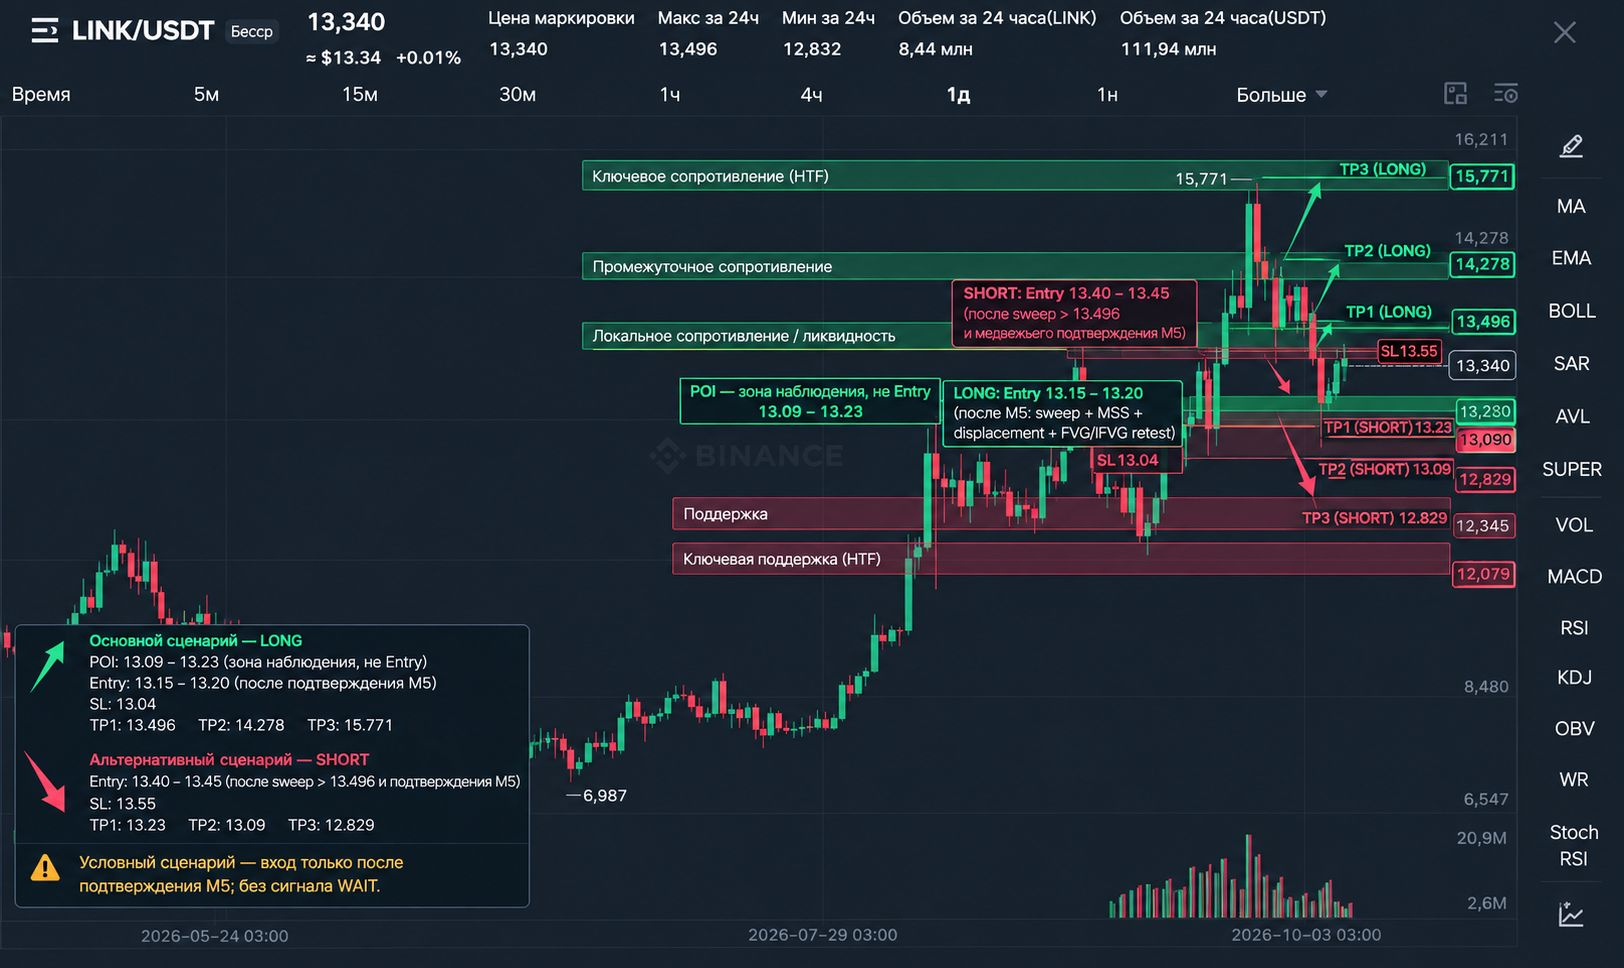
📊 HTF Narrative — market context
On the higher-timeframe chart, LINK still reflects the effects of a massive decline from its all-time local high of 30.947. The subsequent recovery shows that buyers have reclaimed some of their lost ground, but a broader reversal has yet to be confirmed.
On D1, price formed a strong impulse from the 7–9 USDT area to a high of 15.771. A correction followed the sweep of upper liquidity. Price is now recovering from the local low at 12.079, but is facing resistance on lower timeframes.
🎯 Narrative A → B
A: the local low at 12.079 — the area from which the recovery began.
B: nearest upper liquidity is around 13.496; if price holds above it, the next reference levels are 14.278 and 15.771.
Current Delivery: recovery from lower liquidity toward the upper local highs.
Expected Delivery: a retest of 13.45–13.50, with a possible continuation toward 14.278 if buyers confirm control. If price is rejected from the upper zone, a move back toward 13.09 and 12.83 is possible.
⚖️ Bias: neutral-to-bullish on lower timeframes, with correction risk
Key Levels:
15.771 — a significant high and upper liquidity.
14.278 — intermediate resistance.
13.496 — the nearest local high.
13.09–13.23 — the nearest support zone.
12.829 — the local M15 low.
12.079 — the H1 low, a key reference level for the recovery scenario.
📍 POI ≠ Entry
POI to watch: 13.09–13.23 — a potential buyer reaction zone on a pullback. This is not a ready-to-use buy signal.
Primary scenario — LONG: wait for a sweep of local liquidity below, followed by M5 MSS confirmation, an impulsive Displacement, and an FVG/IFVG retest. Only after the full sequence can an Entry be considered, targeting 13.496 → 14.278.
Plan B — SHORT: if price sweeps liquidity above 13.496, forms a bearish MSS, and confirms downward momentum with an M5 FVG/IFVG retest, a move toward 13.23 → 13.09 → 12.829 is possible.
⛔ Invalidation C: For the bullish scenario, losing the 12.829 zone would weaken the local recovery structure; a move below 12.079 would call the entire current impulse from the low into question. For the short scenario, a sustained move above 13.496 without bearish confirmation would weaken the pullback thesis.
⚠️ Entry / SL / TP / RR: I’m not setting these in advance. The attached charts don’t provide enough confirmation of a complete M5 trigger or a precise location for a protective stop. Without that, any RR calculation would be artificial.
🔥 What to do now?
Don’t buy just because price is rising, and don’t open a SHORT just because of resistance.
Wait for a reaction at 13.496 and check M5: Sweep → MSS → Displacement → FVG/IFVG Retest. No confirmation — WAIT.
Comment below: will LINK reach 14.278, or first return to sweep liquidity at 13.09? Tell us which scenario is confirmed by your M5 structure.
