


#Xrp🔥🔥 XRP/USDT — WEEKLY TRADING PLAN
Bounce from $1.3177: the start of a reversal or a correction before another decline?
$XRP/USDT is trading around $1.4125–1.4133. After a sharp decline, the price recovered from the $1.3177 area, but buyers have yet to prove they can change the higher-timeframe structure.
The market is currently between the nearest downside liquidity zone at $1.3865–1.3956 and the upper area at $1.4193–1.4260. The reaction to these levels will help determine the next likely Delivery.
The main task this week is not to guess the direction, but to wait for a liquidity sweep, structural confirmation, and a high-quality entry point.
1. NARRATIVE A → B → INVALIDATION C
A — Where did price come from?
On the higher-timeframe chart, XRP formed an all-time high around $3.6646, then entered a prolonged bearish phase.
On the more recent chart section, price fell from the $1.53–1.58 area to $1.3177. A strong upward reaction followed, taking price back above $1.40.
Thus, at this stage, we are seeing a recovery after the decline. However, a strong green candle or a bounce from the low does not mean that the bearish structure has already been broken.
To confirm a change in direction, we need to see how the market interacts with liquidity and whether it can form a new sequence of higher structural lows and highs.
B — Where is the next expected Delivery headed?
The primary conditional scenario is Delivery to the upper liquidity.
If buyers hold the $1.3865–1.4000 area, sweep the local SSL, and form a confirmed bullish MSS on M5, price may move toward the following reference levels:
$1.4193–1.4260 — nearest upper liquidity;
$1.4478 — the next resistance area;
$1.4973 — a more distant target if the bullish structure holds;
$1.5309 — an additional reference level if the momentum develops.
However, if price fails to hold local support and starts forming a sequence of lower highs and lower lows, focus will shift to the lower liquidity.
In that case, Delivery toward $1.3956–1.3865 is possible, and if the decline continues, toward $1.3177.
C — Invalidation
For the local bullish scenario, $1.3956 is the first warning level. Losing $1.3865 with confirmation of a downside structure would significantly weaken the idea of a continued recovery.
For the bullish continuation scenario, price must be accepted above $1.4260 and hold the broken area on a retest.
Important: the Invalidation level for a specific trade must be determined by the structure of the confirmed M5 trigger. The level that invalidates the overall scenario and the Stop Loss for an individual position are not the same thing.
2. HIGHER- AND LOWER-TIMEFRAME ANALYSIS
W1 — Weekly: global context
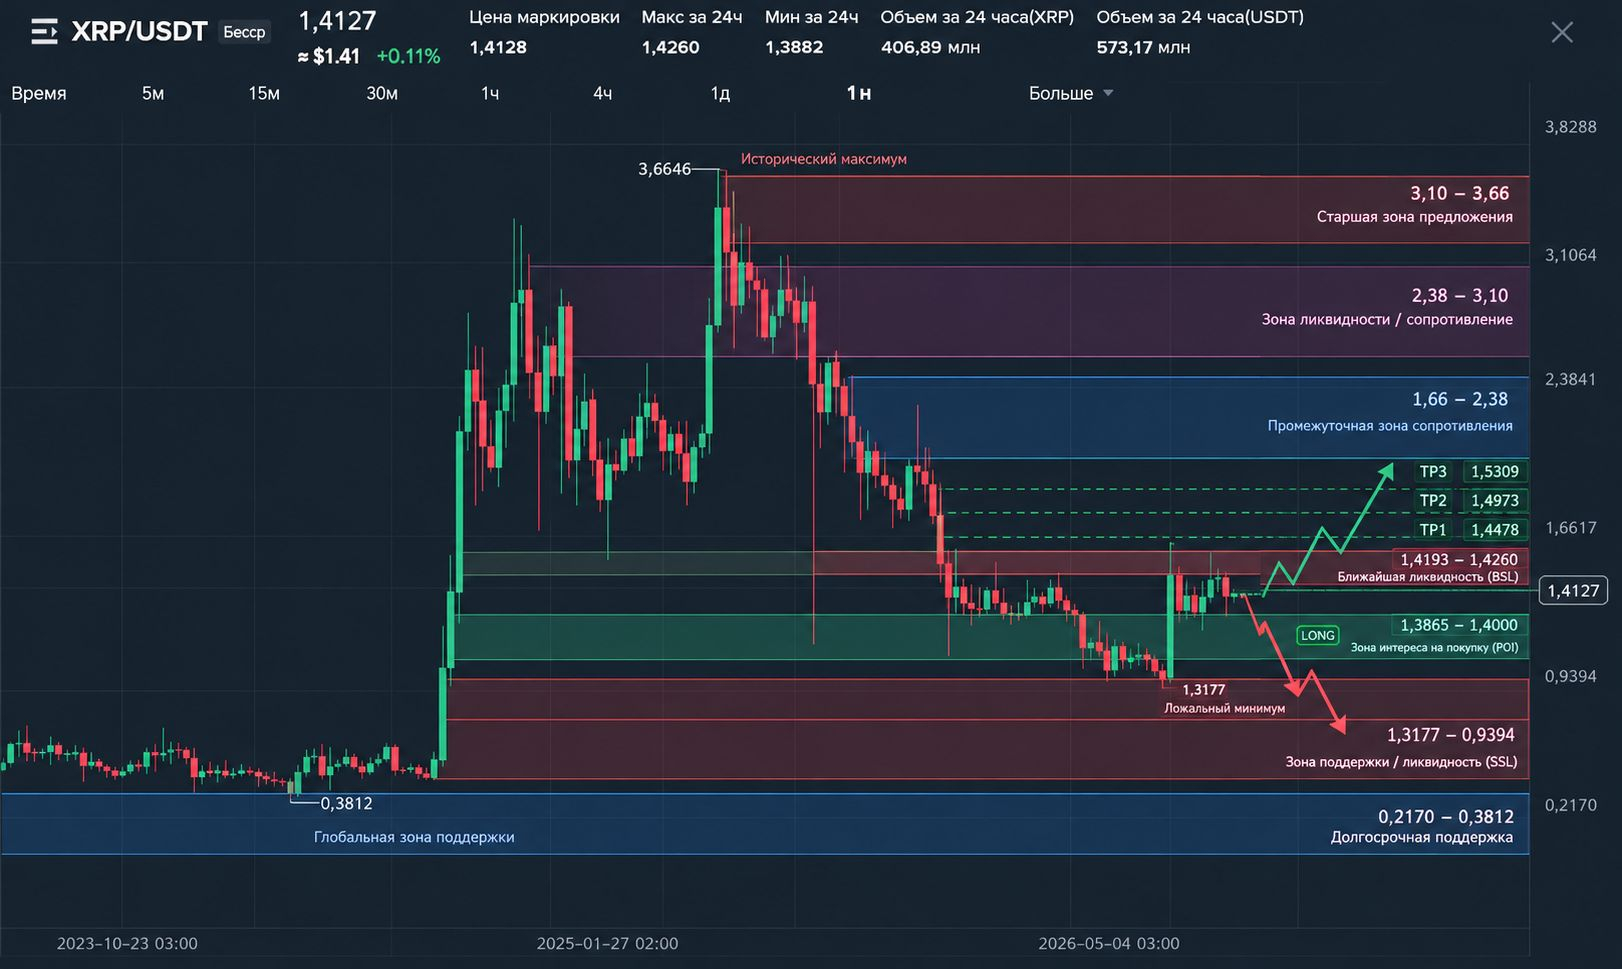
The long-term chart shows a large-scale impulse from around $0.3812 to a high of $3.6646, after which the market entered a prolonged decline.
The current area around $1.41 is significantly below the all-time high. This indicates that the global structure has not yet shown a confirmed recovery of the previous bullish momentum.
W1 takeaway: a long-term reversal is not yet confirmed. For current trading, the more important question is whether the local recovery can develop into a sustained bullish structure.
D1 — Daily: recovery after the decline
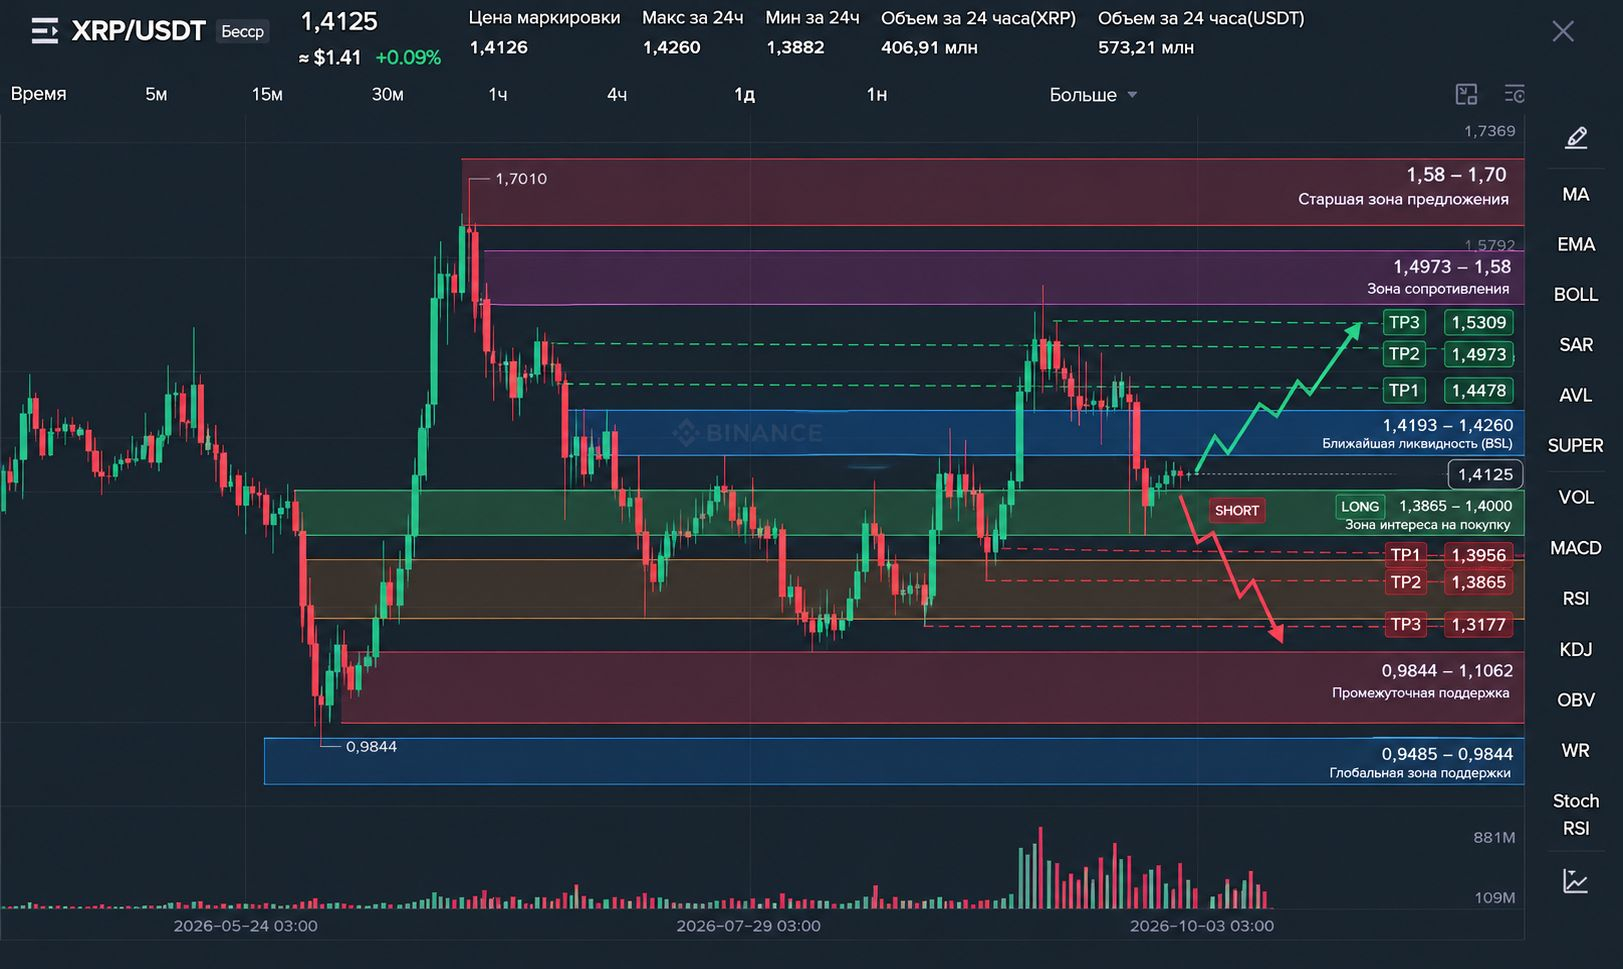
On the provided chart, price formed a low around $0.9844, then rose sharply to $1.7010.
This was followed by a decline, another attempt to rise toward the $1.58 area, and a further bearish phase. Price reached the $1.3177 area, then began to recover.
The latest reaction shows the presence of buyers, but does not yet prove that the bearish correction has ended.
To confirm that the recovery is continuing, the market must clear the nearest local highs and hold above them.
The key D1 question: Is the current rise the start of a more sustained upward Delivery, or merely a correction within the higher-timeframe bearish structure?
H4 — 4 hours: working structure
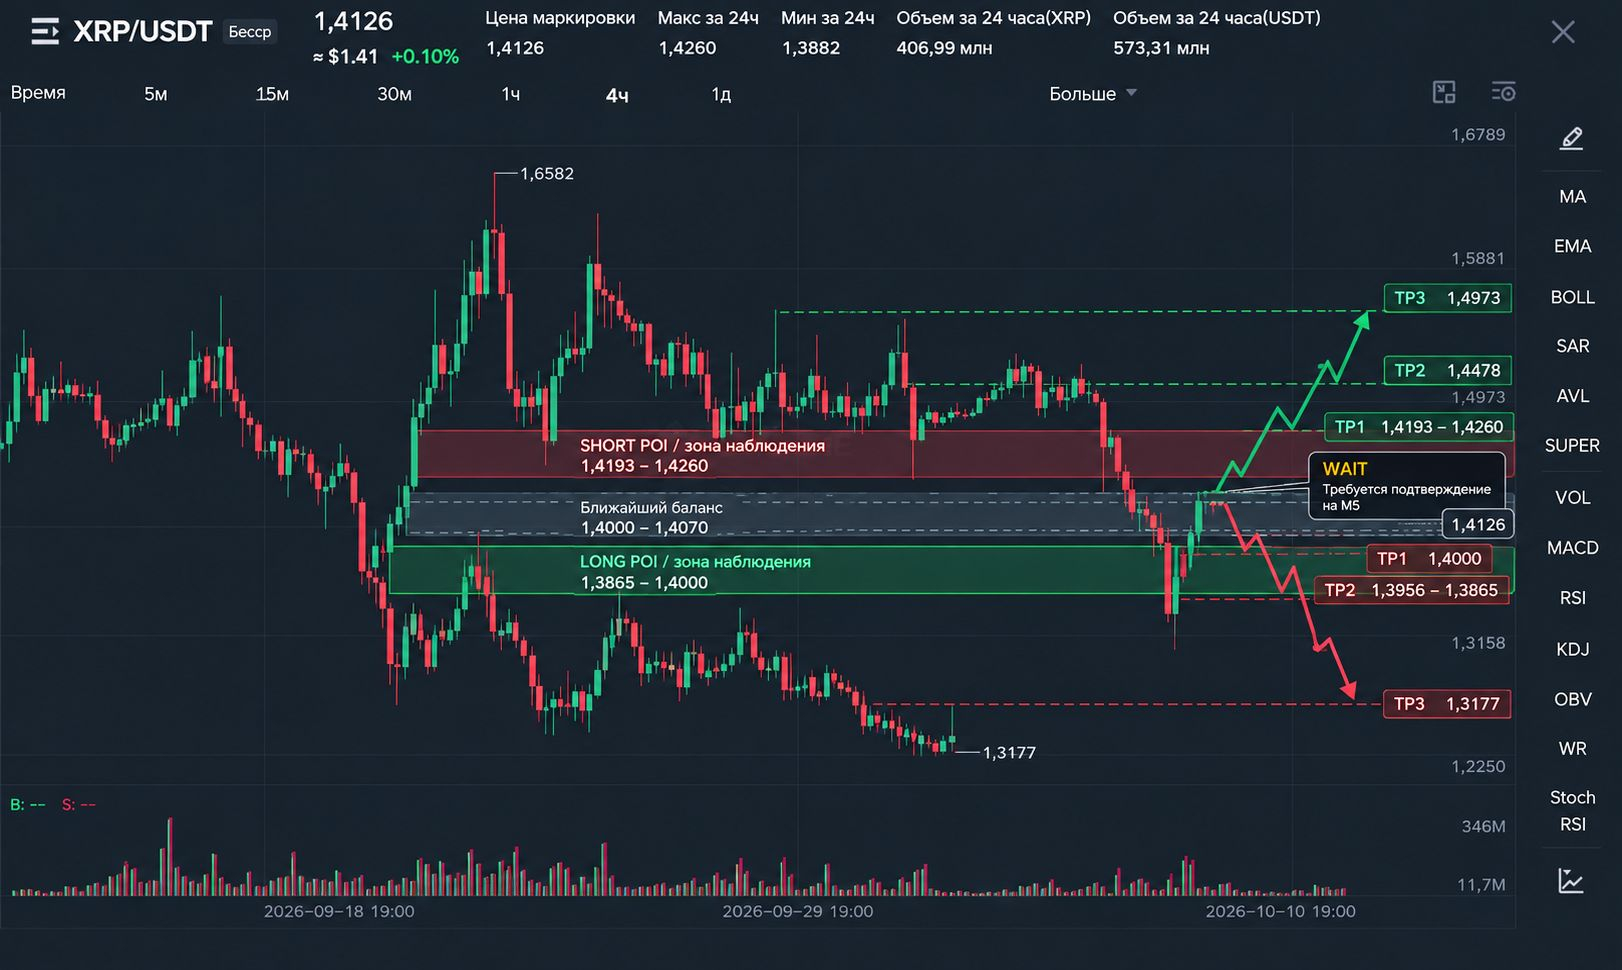
On H4, a decline from the $1.53 area, a reaction from $1.3177, and a subsequent recovery toward $1.41 are visible.
The nearest zone where buyers need to prove their strength is $1.4193–1.4260.
A break of this area alone is not sufficient grounds for an entry. Check whether it is accompanied by displacement, whether it changes the structure, and whether price holds the broken area after a retest.
If price reaches the upper liquidity but fails to hold above it and forms a bearish reaction, there will be grounds to consider an alternative downside Delivery.
H1 — 1 hour: nearest range
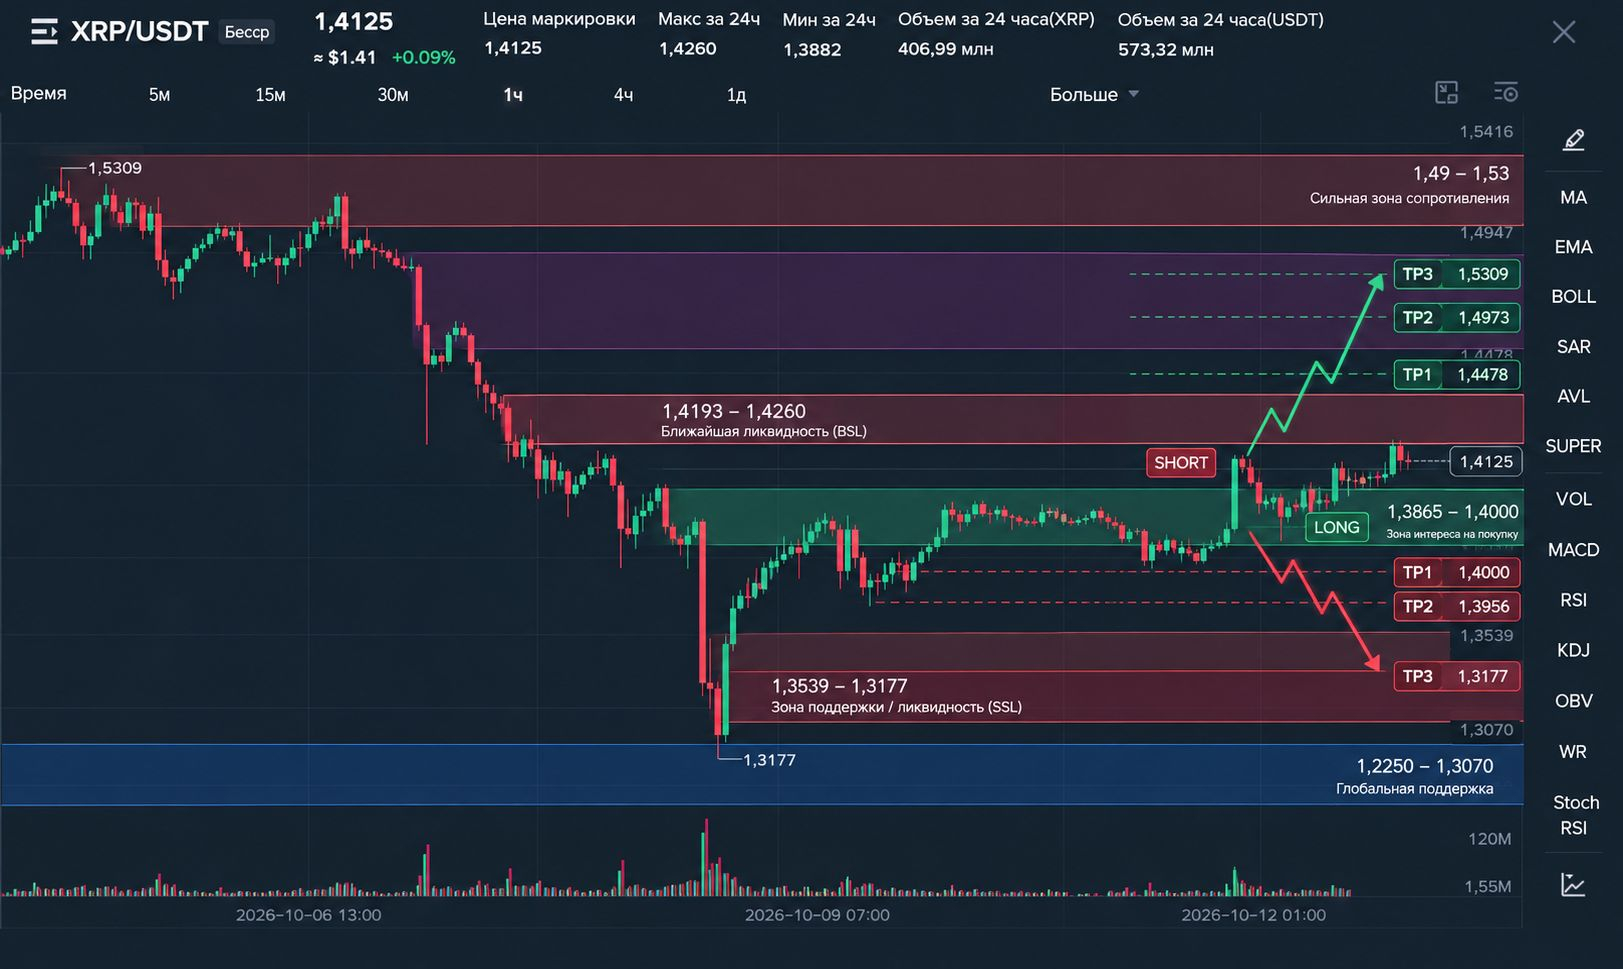
The following reference levels stand out on the hourly chart:
$1.4260 — recent 24-hour high;
$1.4193 — the nearest area of local highs;
$1.4000–1.4070 — the current balance area;
$1.3956 — a local low on one of the provided chart sections;
$1.3865 — a deeper low from the latest move.
Price has recovered after the decline, but is still near a local resistance zone.
If buyers hold $1.40 and form a bullish MSS after taking SSL, the scenario of a move toward $1.4260 can be considered.
If, however, price loses $1.3956 and continues to form a bearish structure, the likelihood of testing $1.3865 will increase.
M15 — 15 minutes: local liquidity
M15 shows impulsive moves up and down, followed by consolidation.
This structure means that price is not yet showing clear control by either side. The local rise may continue, but until the structure is confirmed, it is premature to consider it a full bullish Delivery.
Monitor two situations:
A sweep of the lower liquidity followed by a bullish MSS.
A sweep of the upper liquidity followed by a bearish MSS.
In both cases, direction is determined not by the sweep itself, but by the price reaction afterward.
M5 — 5 minutes: Entry confirmation
On the latest chart provided, price is around $1.413 and trading within a short-term range.
A completed MSS → Displacement → FVG/IFVG Retest sequence cannot be reliably confirmed from a static image.
Therefore, there is currently no confirmed Entry setup.
For a LONG, the following is required:
Liquidity Sweep → Bullish MSS → Displacement → FVG/IFVG Retest → Entry.
For a SHORT, the following is required:
Liquidity Sweep → Bearish MSS → Displacement → FVG/IFVG Retest → Entry.
Until the full sequence appears, the priority is WAIT.
3. KEY LEVELS
Upper liquidity and resistance
$1.4193–1.4260 — the nearest BSL area and a key test for buyers.
$1.4478 — the next reference level if a breakout is confirmed.
$1.4973 — a more distant target.
$1.5309 — an additional level if the recovery continues.
$1.5792–1.7010 — a higher-timeframe supply and liquidity zone.
Lower liquidity and support
$1.4070–1.4000 — the nearest local balance area.
$1.3956–1.3865 — lower liquidity zone and area to monitor for a reaction.
$1.3177–1.3158 — a significant area around the previous low.
$1.2457 — a deeper historical reference level on the provided chart.
The levels are derived from the provided images and are areas to monitor. Their exact values and current relevance should be rechecked on the live chart before trading.
4. DEALING RANGE AND PREMIUM / DISCOUNT
For short-term analysis, we use the following working range:
Dealing Range: $1.3865–1.4260.
Its width is $0.0395.
Range midpoint:
Equilibrium ≈ $1.4063.
Discount
The lower part of the range is approximately in the $1.3865–1.4000 area.
This is an interesting area to monitor for a possible SSL sweep and buyer reaction. However, price being in Discount is not a standalone LONG signal.
Premium
The upper part of the range is approximately in the $1.4070–1.4260 area.
Here, price is approaching the upper liquidity. Monitor for a possible continuation of the bullish Delivery or a BSL sweep followed by a bearish reversal.
At around $1.413, XRP is above the midpoint of the range.
Therefore, buying based solely on the current price is risky: the market could continue upward, reverse from the upper liquidity, or return to the lower part of the range.
Our task is to wait for confirmation, not try to predict the next candle.
5. LIQUIDITY — WHAT TO MONITOR
Buy-Side Liquidity — BSL
The nearest area to monitor is $1.4193–1.4260.
If price rises above the local highs, assess the subsequent reaction.
There are two possible scenarios:
Price accepts higher levels, continues forming a bullish structure, and moves toward $1.4478.
Price sweeps BSL, fails to hold the breakout, and forms a bearish MSS, opening the possibility of a downside Delivery.
A BSL sweep alone does not automatically mean a SHORT.
Sell-Side Liquidity — SSL
The main nearby reference levels are $1.3956 and $1.3865.
If the market sweeps the lower lows, then returns above the sweep level and forms a bullish MSS with displacement, this may create conditions for a LONG.
If price continues to fall after taking SSL without bullish structural confirmation, do not buy simply because the low was swept.
A sweep is a liquidity event. A trading signal appears only after the reaction and structure are confirmed.
6. POI — AREAS TO MONITOR
🟢 LONG POI: $1.3865–1.4000
This is an area to monitor for buyer behavior.
What is required:
Price enters the POI.
SSL is swept.
Forms a Bullish MSS on M5.
Displacement appears.
Price returns to the FVG/IFVG.
Consider an Entry after the retest is confirmed.
If price merely touches the zone and continues falling, there is no entry.
🔴 SHORT POI: $1.4193–1.4260
This is an area to monitor for the sellers' reaction to the upper liquidity.
What is required:
Price enters the POI.
A BSL sweep occurs, or a confirmed bearish reaction appears.
A Bearish MSS forms on M5.
Downward displacement appears.
Price returns to the FVG/IFVG.
Consider an Entry after the retest is confirmed.
If price breaks through the upper area and holds above it convincingly, a SHORT against the continuing bullish structure is not considered.
POI ≠ Entry. The zone marks an area to monitor; it does not authorize opening a position without a trigger.
7. FTA / TA — POTENTIAL DELIVERY
If a LONG is confirmed
FTA — $1.4193–1.4260.
This is the nearest area where price may encounter supply and liquidity from previous highs.
Further reference levels:
TA1: $1.4478.
TA2: $1.4973.
TA3: $1.5309.
Each subsequent target remains relevant only while the bullish structure holds and the previous obstacle is confirmed as cleared.
If a SHORT is confirmed
FTA — $1.4070–1.4000.
Delivery could then potentially continue toward:
TA1: $1.3956–1.3865.
TA2: $1.3177–1.3158.
Deeper reference level: $1.2457 if the decline gathers significant momentum.
These levels do not mean that the market will necessarily reach every target. If opposing structure or a strong reaction appears, the scenario must be reassessed.
8. PLAN A — PRIMARY LONG SCENARIO
The preferred local recovery scenario is considered only if confirmation appears.
Conditions:
Price enters the LONG POI at $1.3865–1.4000.
Sweeps SSL.
Forms a Bullish MSS on M5.
Shows upward displacement.
Returns to retest the FVG/IFVG.
Once the retest is confirmed, there will be grounds for an Entry.
Expected Delivery:
$1.4193–1.4260 → $1.4478 → $1.4973.
Entry: not yet defined — a confirmed M5 trigger is required.
SL: placed beyond the structural level that invalidates the specific trade scenario. The exact level depends on the actual sweep and entry structure.
TP: determined based on confirmed Delivery targets and the nearest FTA/TA obstacles.
RR: calculated only after Entry and SL are defined. Before a signal appears, there is no valid RR value.
Invalidation: losing $1.3865 with confirmed continuation of the bearish structure would significantly weaken the primary scenario.
9. PLAN B — ALTERNATIVE SHORT SCENARIO
If price rises to $1.4193–1.4260, takes the upper liquidity, and forms a bearish reaction, an alternative downside scenario may emerge.
Conditions:
A BSL sweep in the upper zone.
Bearish MSS on M5.
Downward displacement.
FVG/IFVG retest.
Confirmation that the bearish structure is continuing.
Expected Delivery:
$1.4070–1.4000 → $1.3956–1.3865.
If the lower liquidity is lost, the next significant target could be the $1.3177 area.
Entry: only after full M5 confirmation.
SL: beyond the high of the confirmed sweep, accounting for structure and volatility.
TP: taken in stages based on the actual price reaction at FTA/TA.
RR: not set in advance; calculated based on the actual entry point, stop, and achievable target.
Invalidation: sustained upward continuation and acceptance above the upper zone, without a confirmed bearish MSS, remove the basis for a SHORT entry under this scenario.
10. RISK MANAGEMENT AND SCENARIO CONTROL
Three concepts must be distinguished:
POI — an area where we expect a reaction.
Entry — the specific entry point after a confirmed trigger.
Invalidation — a condition under which the original trade idea is no longer valid.
The Stop Loss should correspond to the structure of the specific entry. It should not be chosen solely based on the desired profit size.
RR is calculated once Entry and SL are available:
RR = potential profit / potential loss.
If there is too little room to the nearest target and the structural stop is wide, the trade may not be worthwhile even if a formal signal appears.
Do not enter in the middle of the range, chase momentum, or open a position simply because price has reached a POI.
11. FINAL WEEKLY BIAS
Higher-timeframe context: a global downside correction; a reversal is not confirmed.
Local context: recovery from $1.3177 to $1.41, but the nearest upper liquidity still needs to be tested.
Primary area to monitor: $1.3865–1.4000 for a potential LONG.
Alternative area to monitor: $1.4193–1.4260 for a potential SHORT if rejection from the upper liquidity is confirmed.
Nearest bullish target: $1.4260, then $1.4478.
Nearest bearish target: $1.3956–1.3865, then $1.3177.
Current status: WAIT. There is no confirmed Entry on the provided screenshots.
WHAT TO DO NOW?
Do not try to guess the direction inside the $1.3865–1.4260 range.
Wait for one of two scenarios:
🟢 SSL sweep → Bullish MSS → Displacement → FVG/IFVG Retest → LONG.
🔴 BSL sweep → Bearish MSS → Displacement → FVG/IFVG Retest → SHORT.
Calculate Entry, SL, TP, and RR only after confirmation.
Add XRP to your watchlist and monitor the price reaction at key zones. Don't chase price—wait for the market to show the direction of the next Delivery.

