


Today's LAB market action is putting on a gripping show: “major players luring traders into longs, then cashing in on retail investors chasing the rally!”
At first glance, prices have surged by more than 5% and sentiment is overwhelmingly bullish. But looking beneath the surface of the data, this is actually a carefully orchestrated “bull trap.”
Let's break down what's really behind this 5% rally:
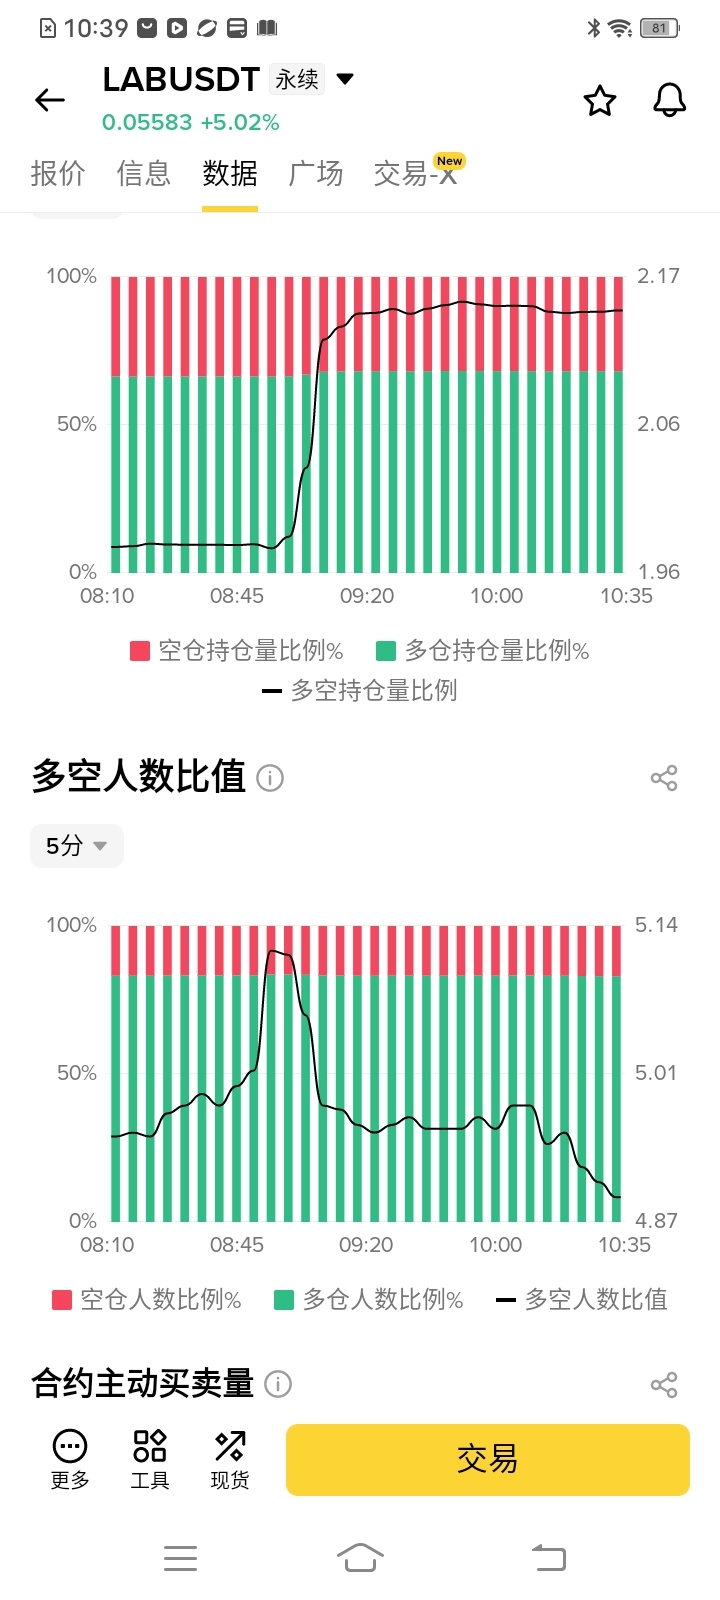
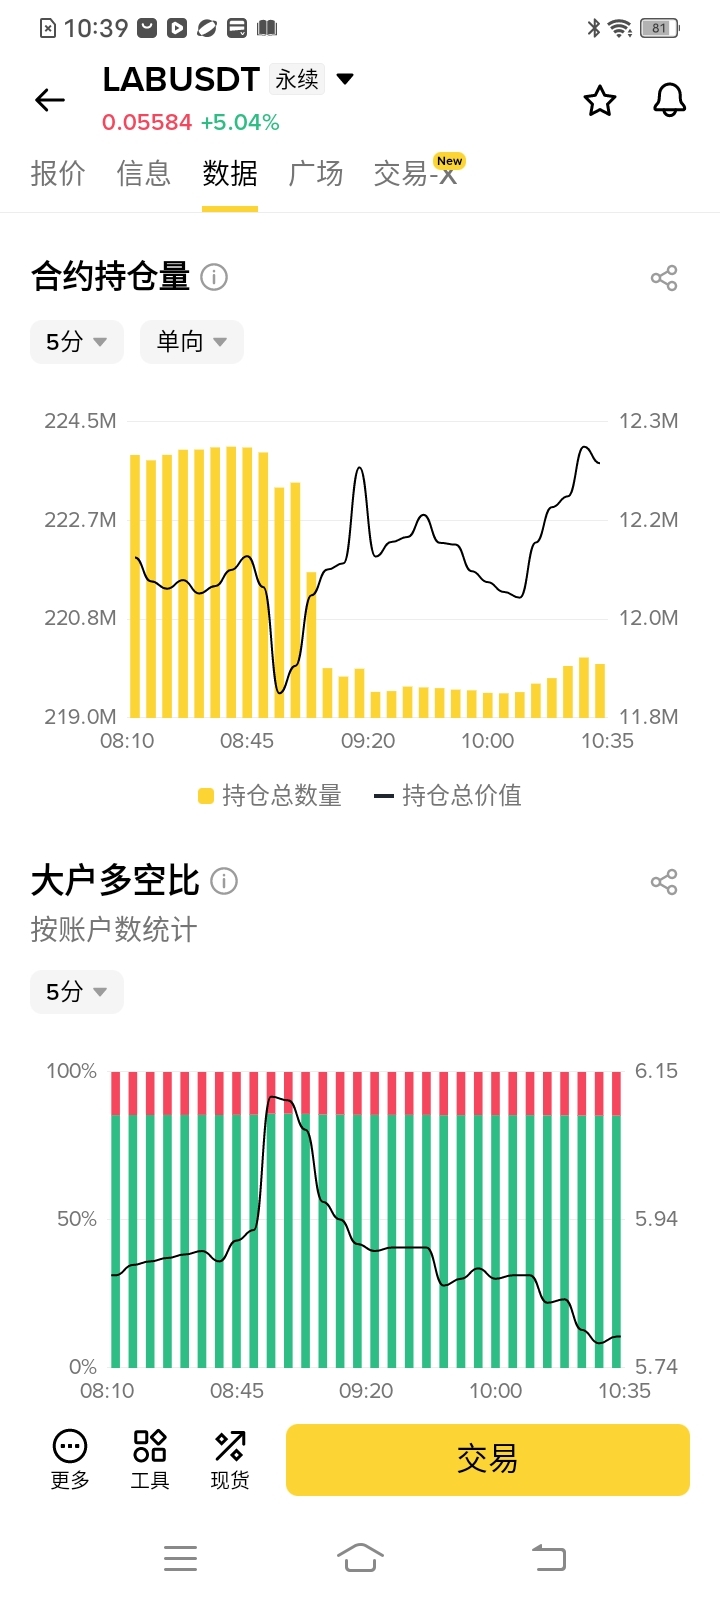
1. A critical warning sign: retail sentiment is overheated while large investors cash out near the highs (top of Chart 3 & Chart 4)
Retail investors are piling in aggressively (bottom of Chart 3 & bottom of Chart 4): the long-to-short account ratio plunged from 5.14 to 4.87. This means that after prices rose, a large number of retail investors rushed in to go long (the lower the long-to-short ratio, the more retail investors are going long). Retail investors have become extremely caught up in the euphoria of chasing the rally.
Large players are quietly heading for the exits (top of Chart 4): In contrast to retail traders, the long/short ratio for large players by account count is also falling steadily (from 6.15 to 5.74). While retail traders are opening long positions aggressively, large players are opening shorts or closing longs—a classic case of “selling into strength.”
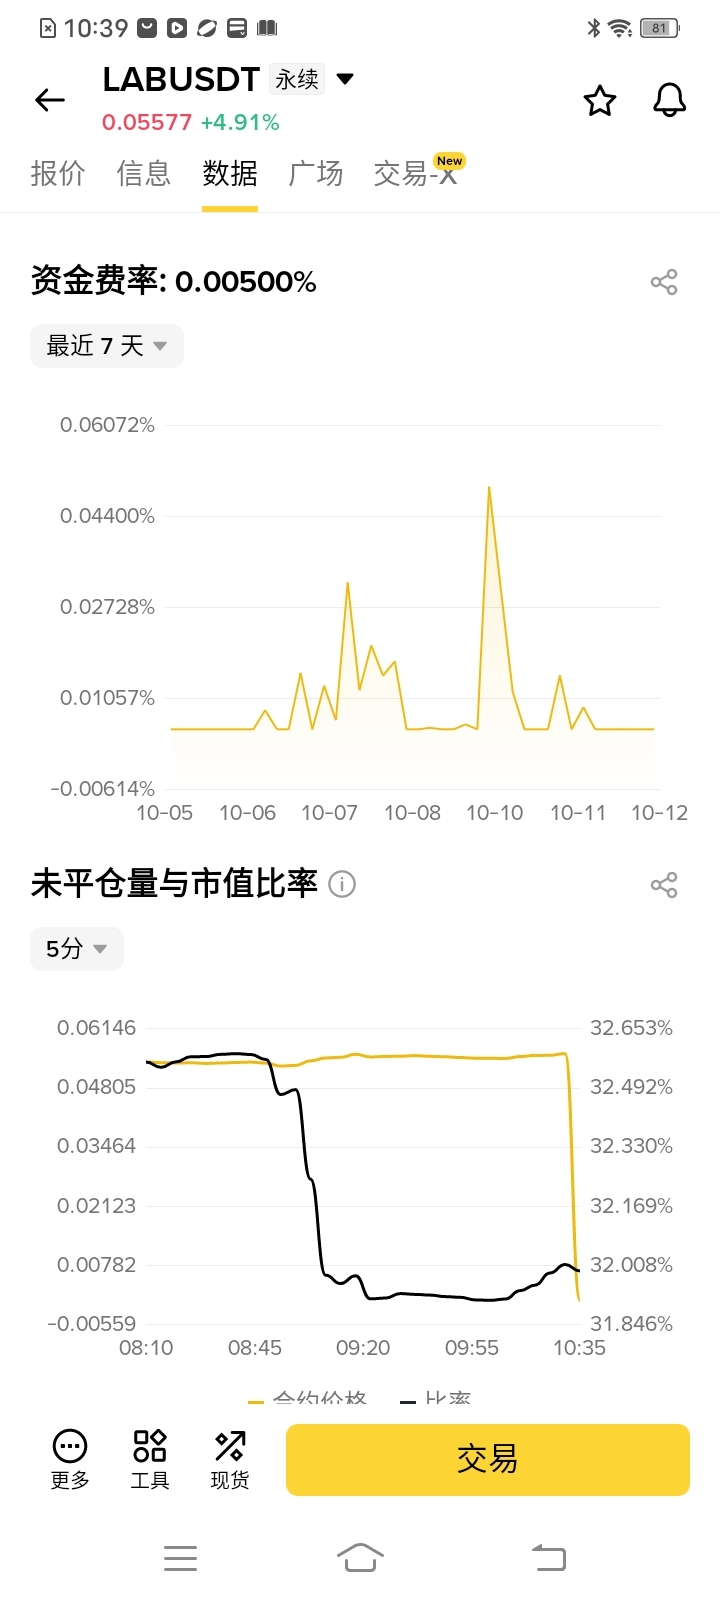
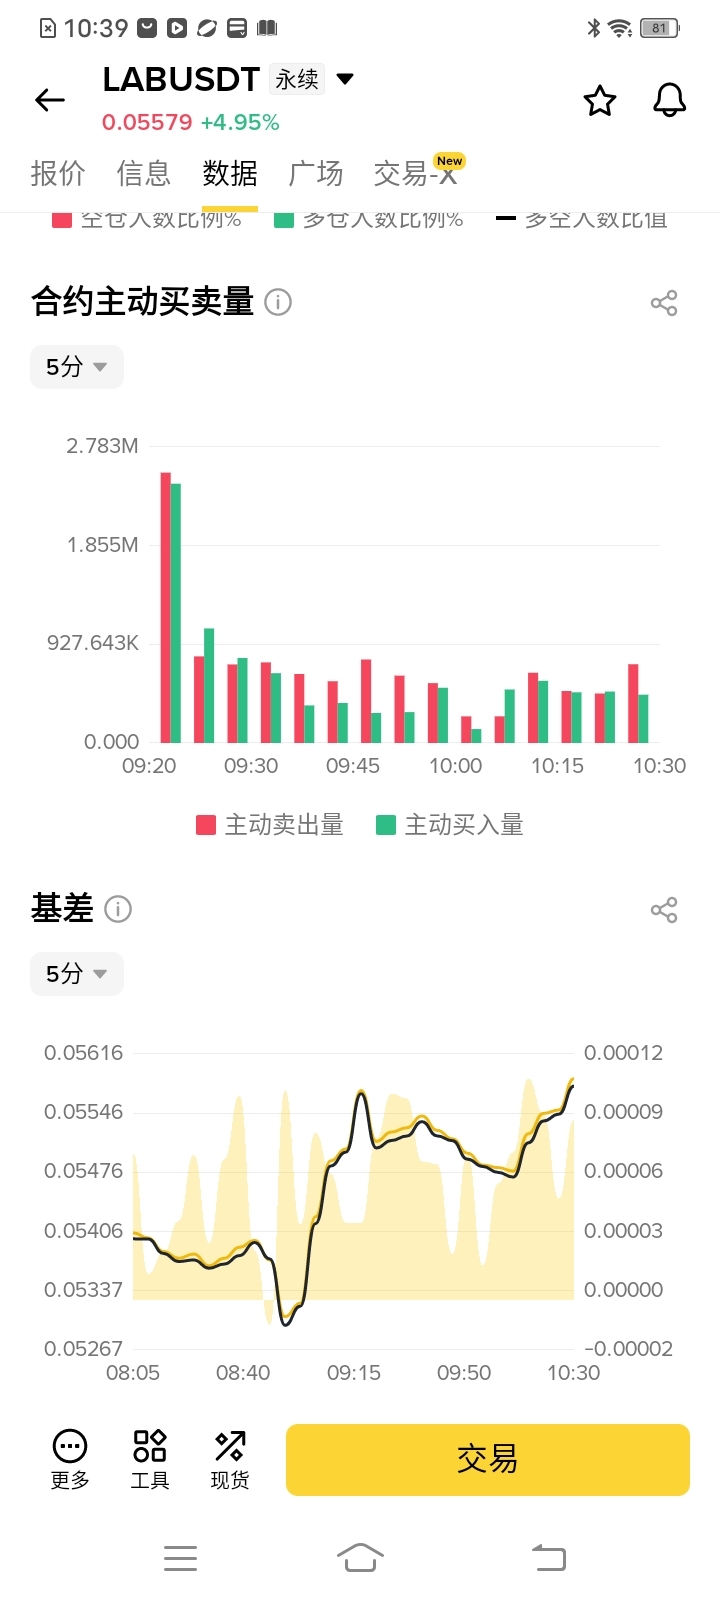
2. Market flows: Basis turns positive as major players “lure buyers in” (bottom of Chart 1 & top of Chart 2)
Basis turns unusually positive (bottom of Chart 1): After 08:45, as the price rebounded, the basis (yellow line) continued rising and remained positive. This means retail buying is pushing the futures market higher, even above spot prices. This is often a clear sign that retail traders are chasing the rally.
Open interest signals trouble brewing (bottom of Chart 2): During the sharp rally from 09:00 to 09:20, the black line (ratio) fell steeply. This usually means major players are using the volatility to close long positions and sell.
3. Positioning dynamics: A wall of trapped holders lies overhead (top of Chart 1 & top of Chart 5)
Liquidation heatmap (top of Chart 1): There is a very dense band of yellow liquidation levels between 0.0577 and 0.0608. If the price reaches this zone, it will trigger a large number of short stop-losses (short liquidations), while also prompting trapped longs from earlier to sell as they break even. This zone is an absolute “no-go area” for bulls.
Open interest falls (top of Chart 5): During the latest rally around 10:30, total open interest (yellow bars) did not increase significantly; instead, it fell somewhat at the highs. This suggests the rally lacks support from new capital, especially large-scale buying by major players.
4. Technicals: Price reaches a high-risk zone, indicators are deeply overbought (Chart 6)
Candlestick pattern (Chart 6): On the 15-minute chart, the price has just touched a 24-hour high of 0.05634, reaching the upper Bollinger Band (UP: 0.05605).
KDJ indicator (bottom of Chart 6): The J value has climbed to 94.13, deep in overbought territory. At this level, the price could see a technical pullback at any time.
Overall Conclusion and Trading Recommendations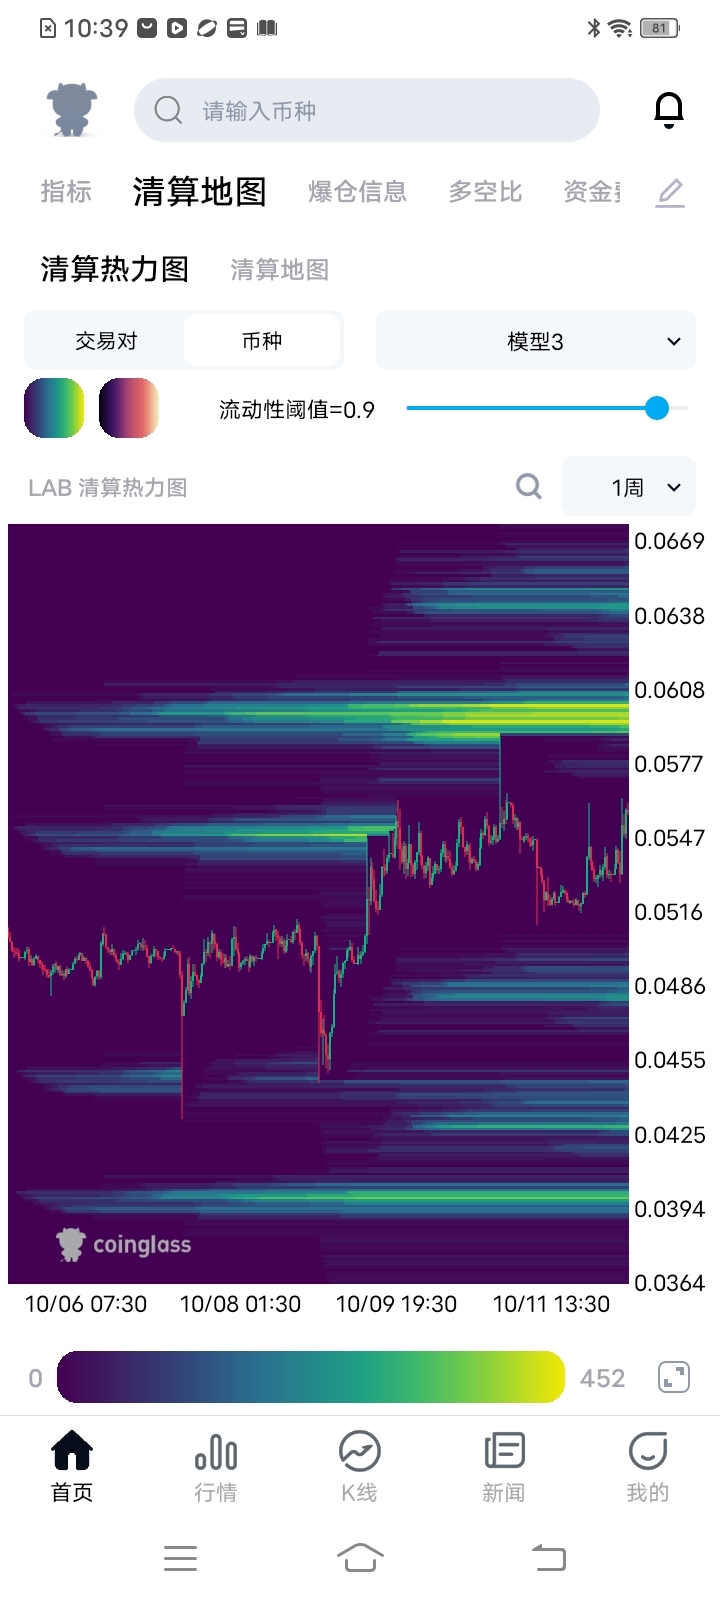
Key takeaway: LAB’s 5% surge is a classic “retail traders chasing the rally and getting stuck” setup. Major players are quietly selling into the rally as the basis turns positive and retail sentiment heats up, while the price has already reached a high liquidation-risk zone. Don’t blindly chase the rally—major players could lure buyers in at any moment$LAB $ARX $ARB