

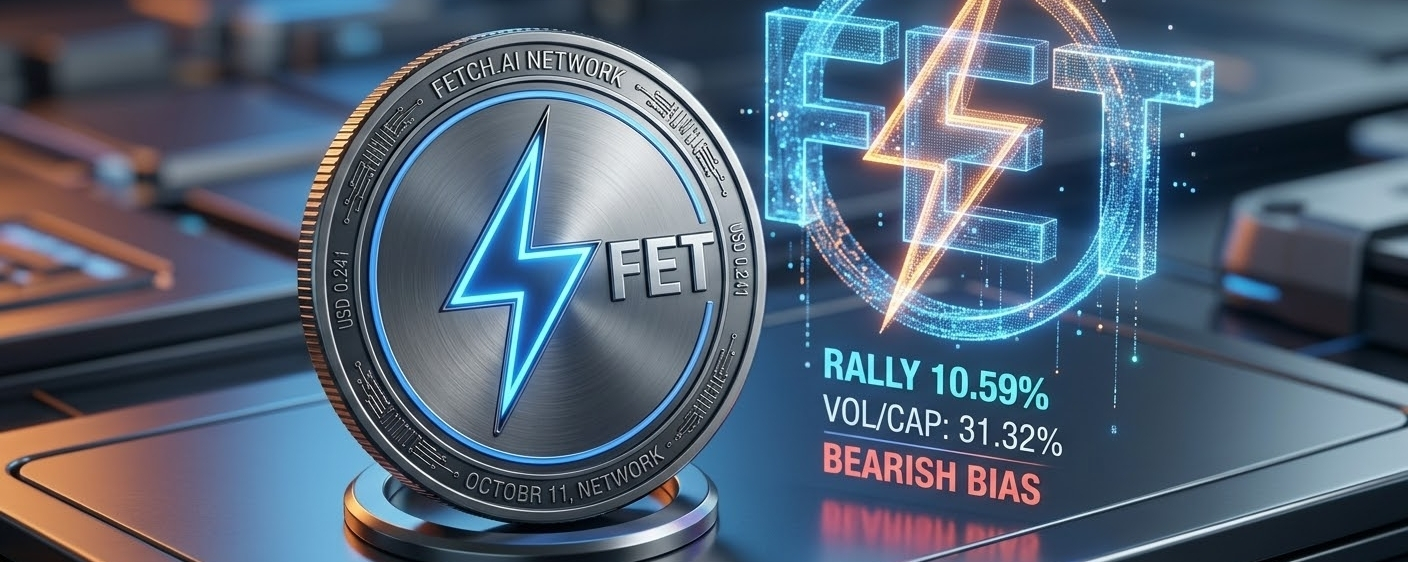

⚡️ FET gains 10.59% and tests key resistance on October 11, 2026
FET has rallied sharply and is trading above its major moving averages, but volume remains below its 30-day average and the MACD retains a bearish bias. Without a verifiable catalyst or data on derivatives or on-chain activity, the rally needs to confirm key levels before it can be assumed to mark the start of a sustained trend.
*** This analysis does not constitute investment advice.
Always do your own research and consider your goals and financial situation before investing in cryptocurrencies. FET is trading at USD 0.2414803, after posting a reported daily gain of 10.59%. However, that percentage does not match the calculation against the previous close, which comes to about 9.29%, or the change since the open, which is close to 10.39%; the difference may be due to different timestamps or reference points.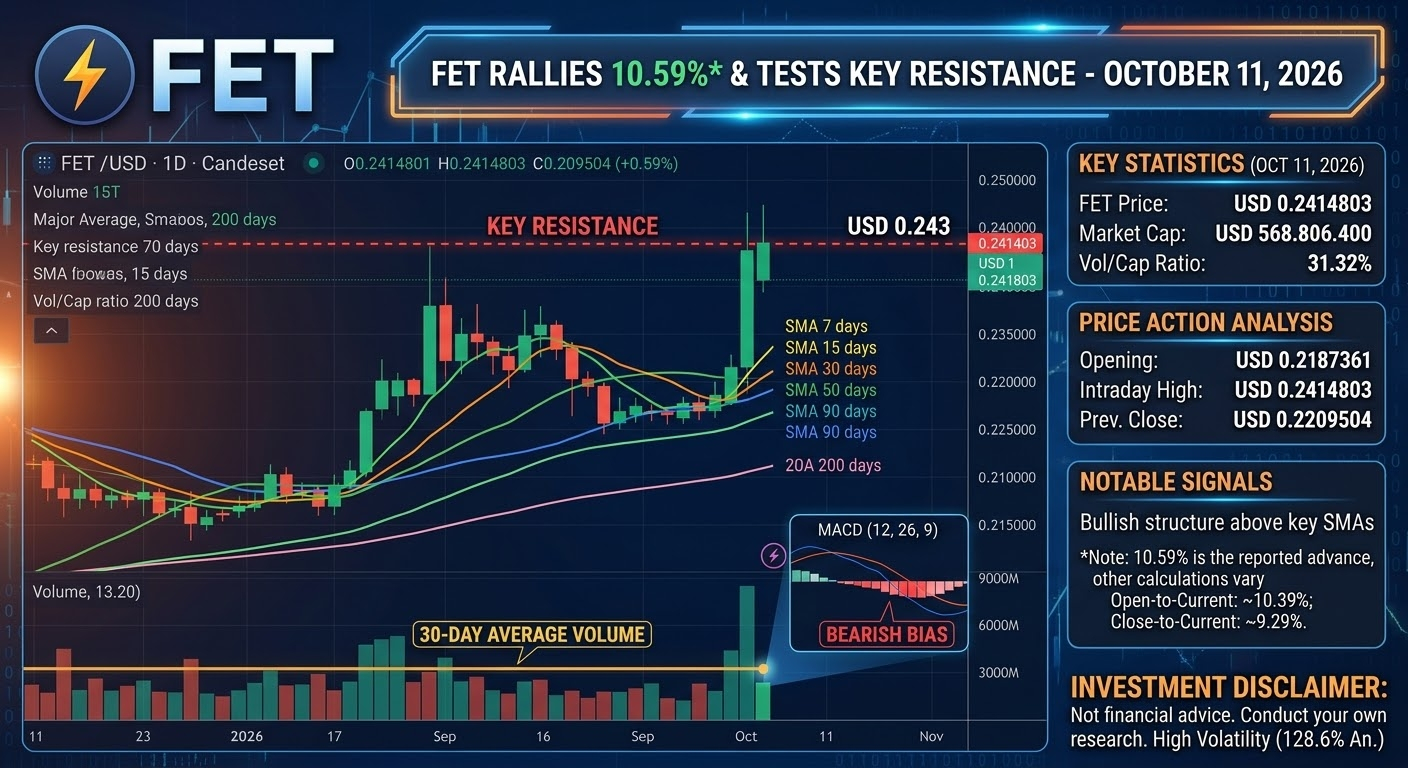
To assess the move, it is best to treat the published percentage as indicative and prioritize observable prices and technical levels. The price is above the 7-, 15-, 30-, 50-, 90-, and 200-day SMAs, a favorable picture for the short- and medium-term structure. Even so, the MACD shows a negative histogram, and daily volume, although significant, is below its monthly average.
The more cautious thesis is that there has been a rebound with partially favorable technical signals, but confirmation is still lacking to call it a sustained trend reversal. The reported market capitalization is USD 568,806,400, and the volume-to-market-cap ratio is 31.32%, evidence of intense trading relative to the asset's size. No figures are provided for supply, on-chain adoption, funding rates, open interest, liquidations, or institutional flows; therefore, it is not possible to validate the rally using those factors. The baseline stance is to hold or wait for confirmation, with risk limits adjusted for the high annualized volatility of 128.6%. The confirmed data point is FET's strong advance during the session: the price moved from an opening price of USD 0.2187361 to USD 0.2414803, and the reported intraday range was USD 0.2207597 to USD 0.2414803. The published daily percentage, 10.59%, does not share an explicitly stated basis with the previous close of USD 0.2209504, so calculations using the opening and closing prices produce different changes. This methodological difference does not invalidate the rise, but it does advise against mixing returns as if they were equivalent. The available information does not include any news
📰 Source: DiarioBitcoin
🔗#Fetch_ai #fet.ai #TradingSignals #TradingCommunity #FET $FET