


$STRK The current market action is fascinating. It looks like a rebound, but the data is already flashing red—this looks more like a contest in which “retail traders band together to save themselves while major players watch from the sidelines at elevated levels”!
Using the latest 5-minute chart data, let’s break down what’s behind this 12% surge:
1. Funding flows: Retail traders are stubbornly holding long positions, and futures sentiment is extremely fragile (Fig. 4)
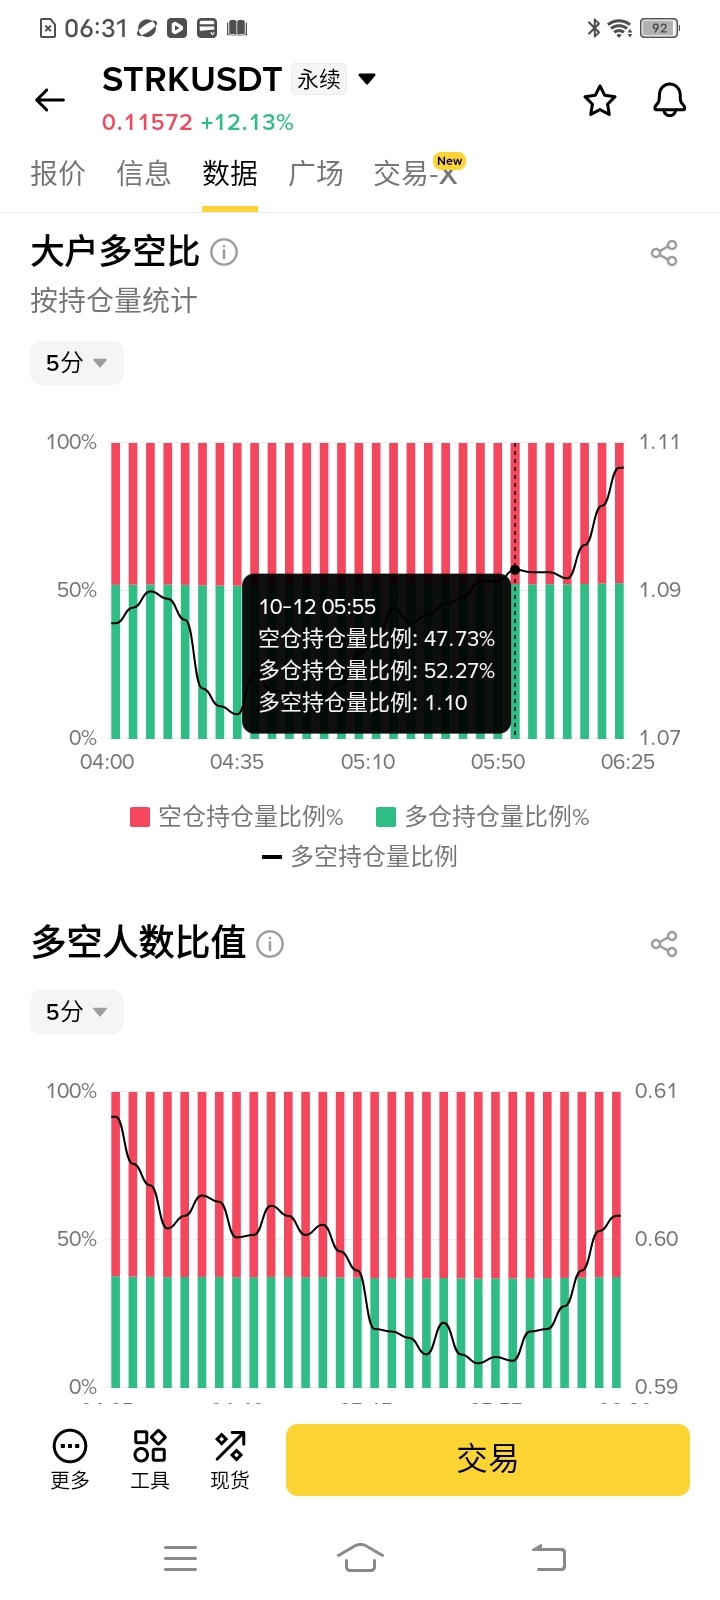
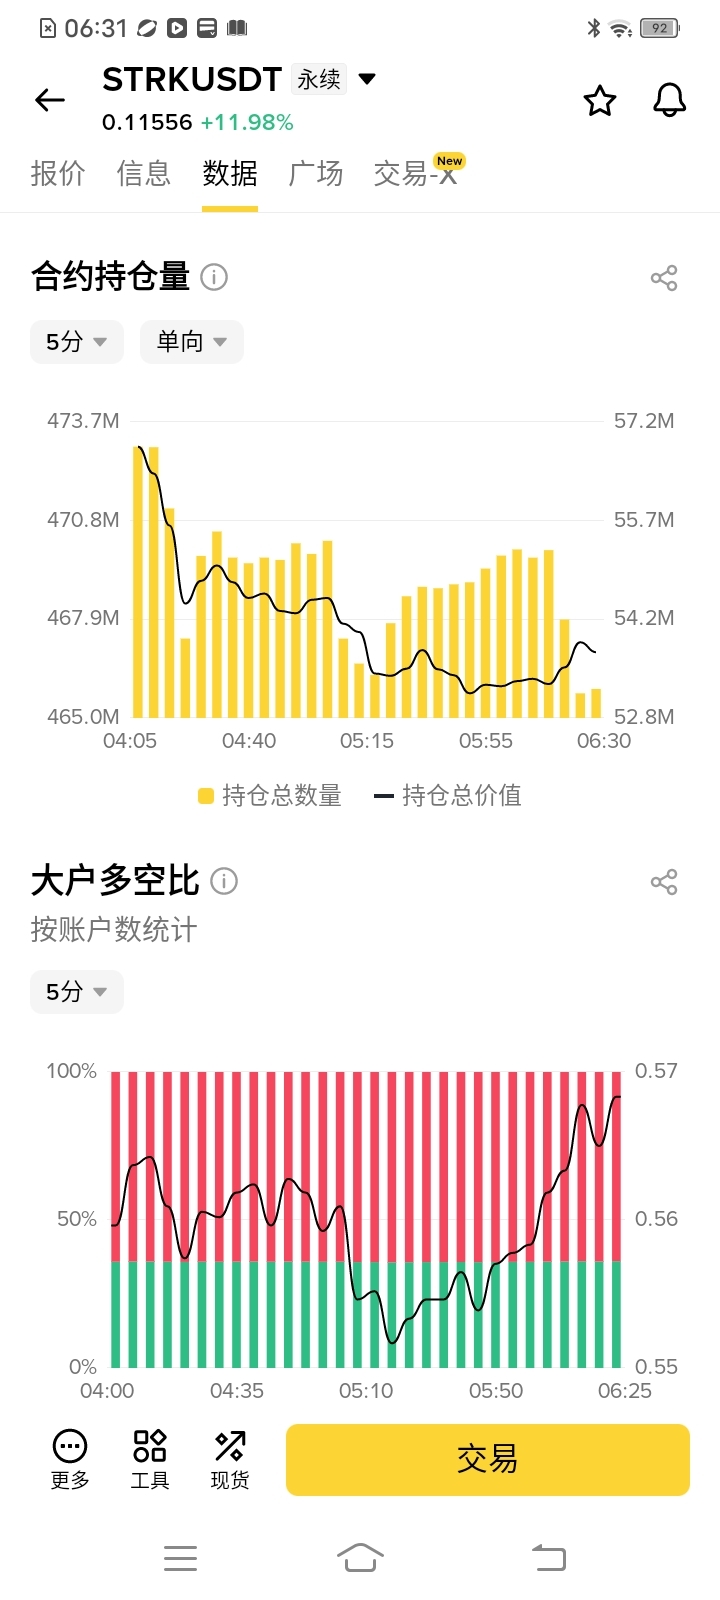
* Retail traders are aggressively opening long positions (bottom panel of Fig. 4): The large-trader long/short ratio by account count (a proxy for retail sentiment) surged from 0.55 to 0.57, indicating that many retail traders were actively opening long positions during the rebound after 05:45.
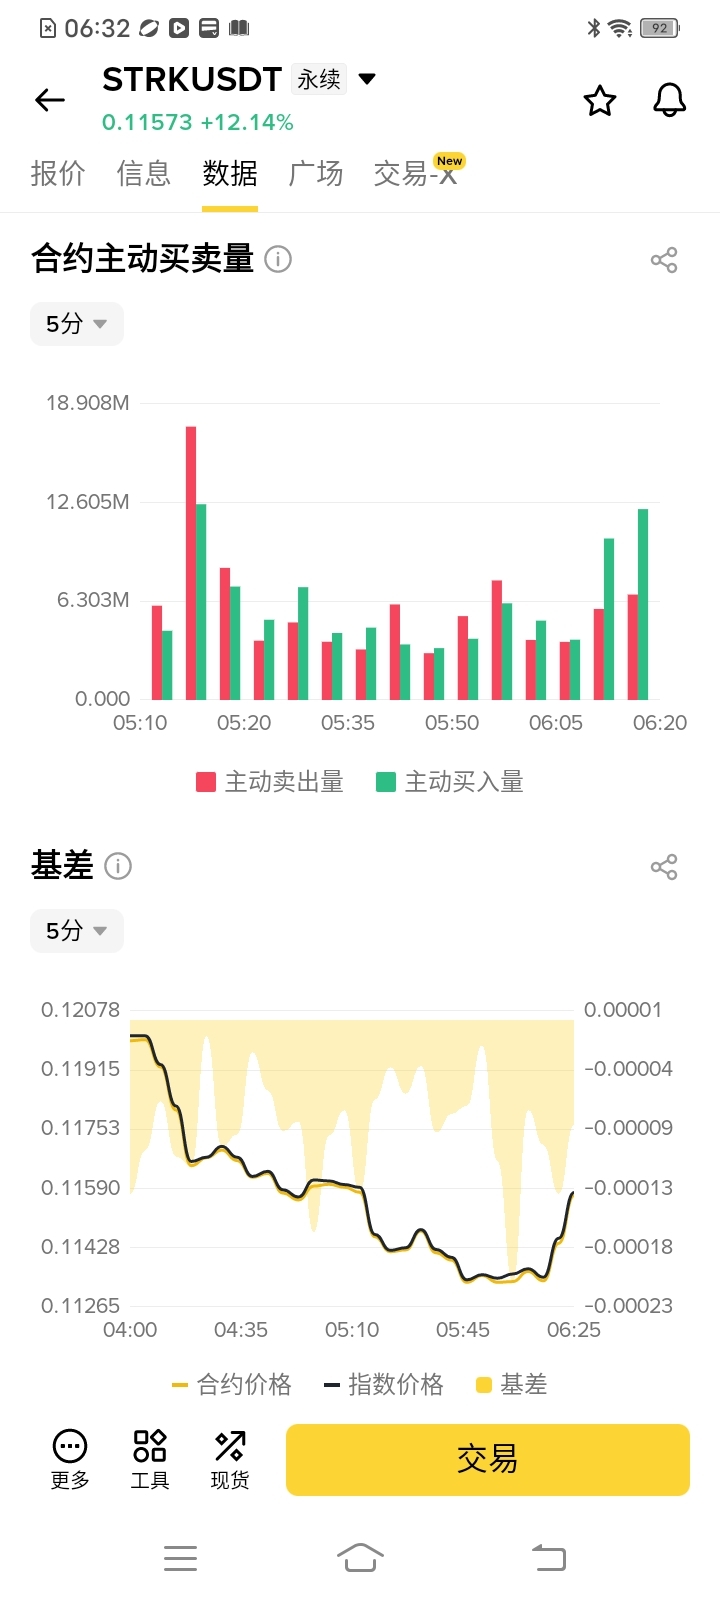
* The basis remains negative (Figure 3, bottom): As the price rebounds, the basis (yellow line) has not turned positive; instead, it has continued to fall, even reaching a new low around 05:45. This suggests that futures prices are scrambling to catch up with spot prices and that buying pressure from longs is seriously lacking. This rally is likely being driven by short covering, making it very fragile.
2. Positioning dynamics: Whales are reducing positions at highs, while capital quietly exits (Figure 3, top & Figure 5)
* Whales distributing at highs (Figure 3, top): Although the whale long/short ratio based on positions recovered somewhat to 1.11 after 05:50, the overall position ratio continued to fluctuate at a high level, with no large-scale increase in positions alongside retail traders.
* Open interest is showing signs of movement beneath the surface (Figure 5, top): During the sharp rally from 05:40 to 05:55, the total value of open positions (black line) did not rise steadily; instead, it dropped noticeably from a higher level. This suggests that large players were closing long positions and taking profits as the price rose, rather than adding to their longs.
3. Technical analysis: Heavy overhead resistance and weak indicators (Figures 1 & 6)
* Liquidation heatmap (Figure 1): Dense liquidation bands are clustered in the 0.1184–0.1215 range. If the price touches this zone, it could trigger a large wave of stop-losses or selling by traders trying to break even.
* Candlesticks and indicators (Figure 6): The 1-hour chart shows the price sitting between the middle band (0.11274) and the upper band (0.12132). Although the KDJ indicator has formed a bullish crossover (J: 42), momentum is weak. This is a typical corrective rebound in a weak market.
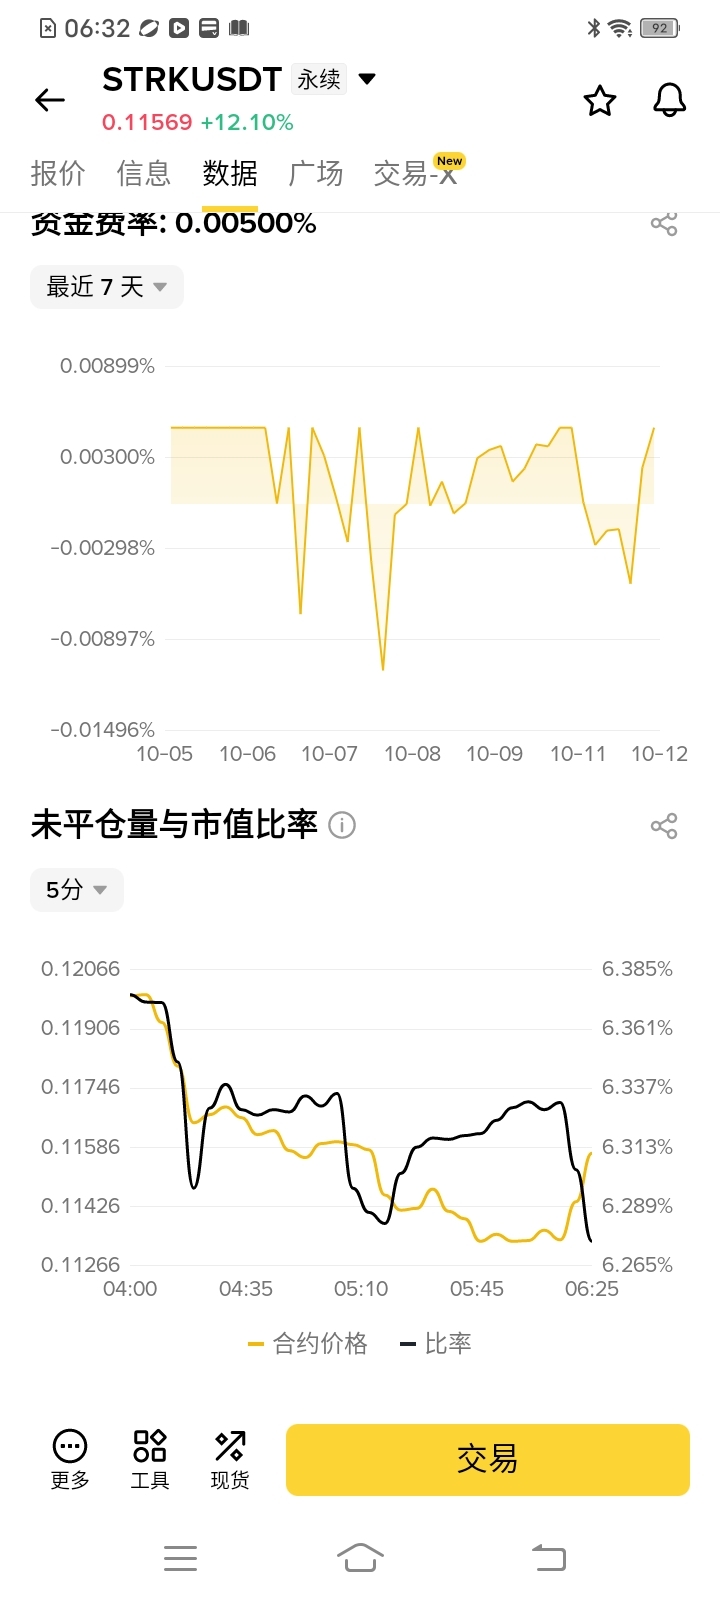
4. Funding rate: Longs are “paying to stay alive” (Figure 2)
* Funding rate (Figure 2): The rate has risen to 0.00500% (positive). Although it is not high at the moment, a positive funding rate means longs have to pay interest to shorts. With the basis remaining negative and buying pressure from longs lacking, the cost of holding long positions is gradually increasing.
Overall conclusion and trading recommendations
Key assessment: STRK is on the dangerous edge of a market where retail traders are trying to buy the dip while major players are staying cautious or distributing at highs. This 12% rebound lacks sustained buying from major players, and the price could retest the lows at any moment if retail traders can’t hold on.
* If you’re holding a long position (short-term trade):
* Reduce positions into strength; don’t get greedy! The price is currently stuck at 0.11If you’re holding a long position (short-term trade):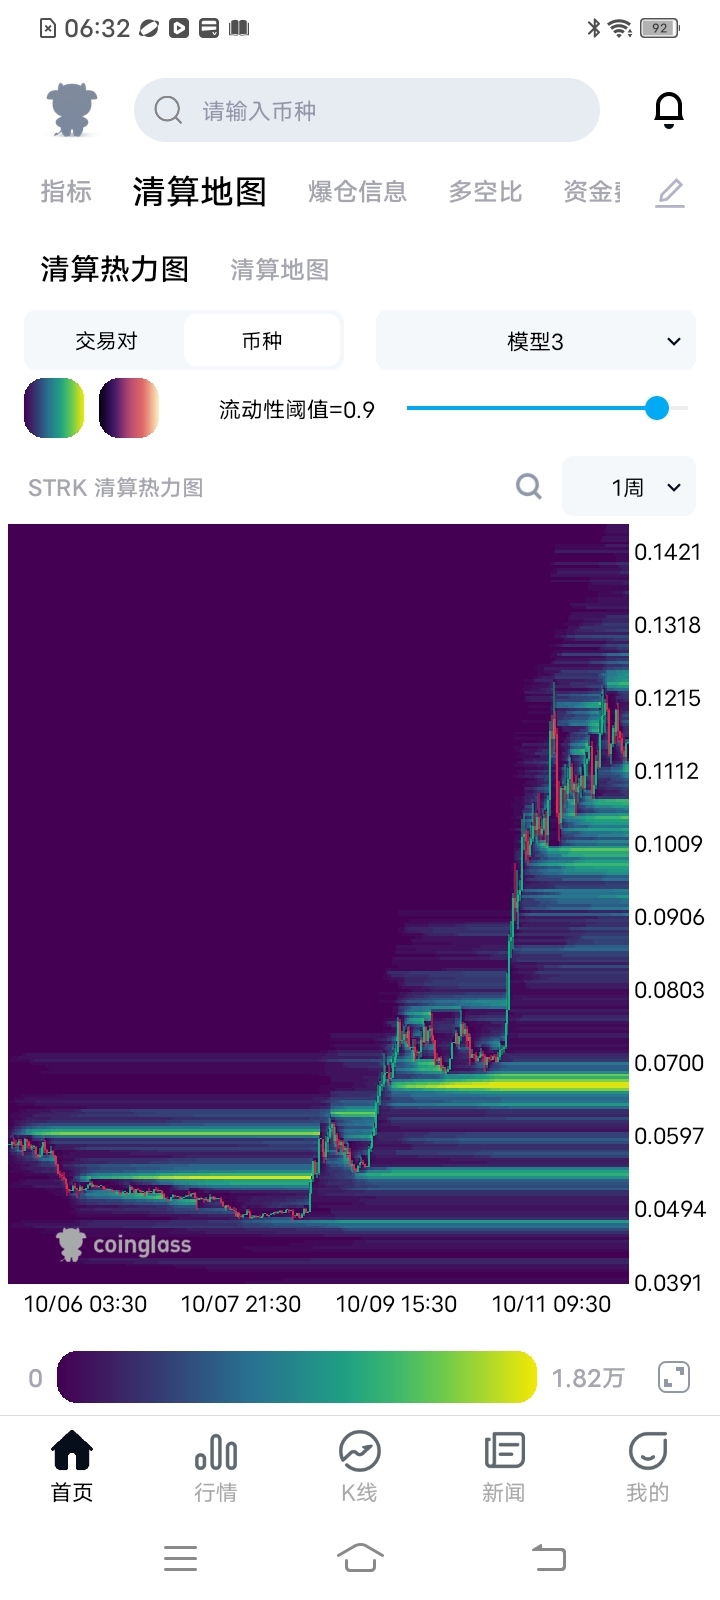
Reduce positions into strength; don’t get greedy! The price is currently stuck in the 0.115–0.120 resistance zone. Consider taking profits in stages or moving up your stop loss while the indicators stage a modest rebound.
Risk management: Keep your stop loss firmly at 0.111 (below support at the middle band). A break below this level would mean the rebound has completely failed, and bulls should exit without hesitation.
If you’re considering opening a short (for a more conservative approach):
Look to short into strength from the right-hand side of the chart, aiming for a retest of the lows.
Entry: Wait for the price to rally again and fail to break through 0.118–0.120, with a high-volume bearish candle appearing, then try a small short position.
Stop-loss: Set it at 0.124 (exit if the price breaks above the recent high).
Target: Look toward the 0.108–0.110 area.
If you’re considering going long:
Absolutely do not chase a long! Going long while the basis is negative and major players are reducing their positions is like “carrying” retail traders who are preparing to exit. $CKB