

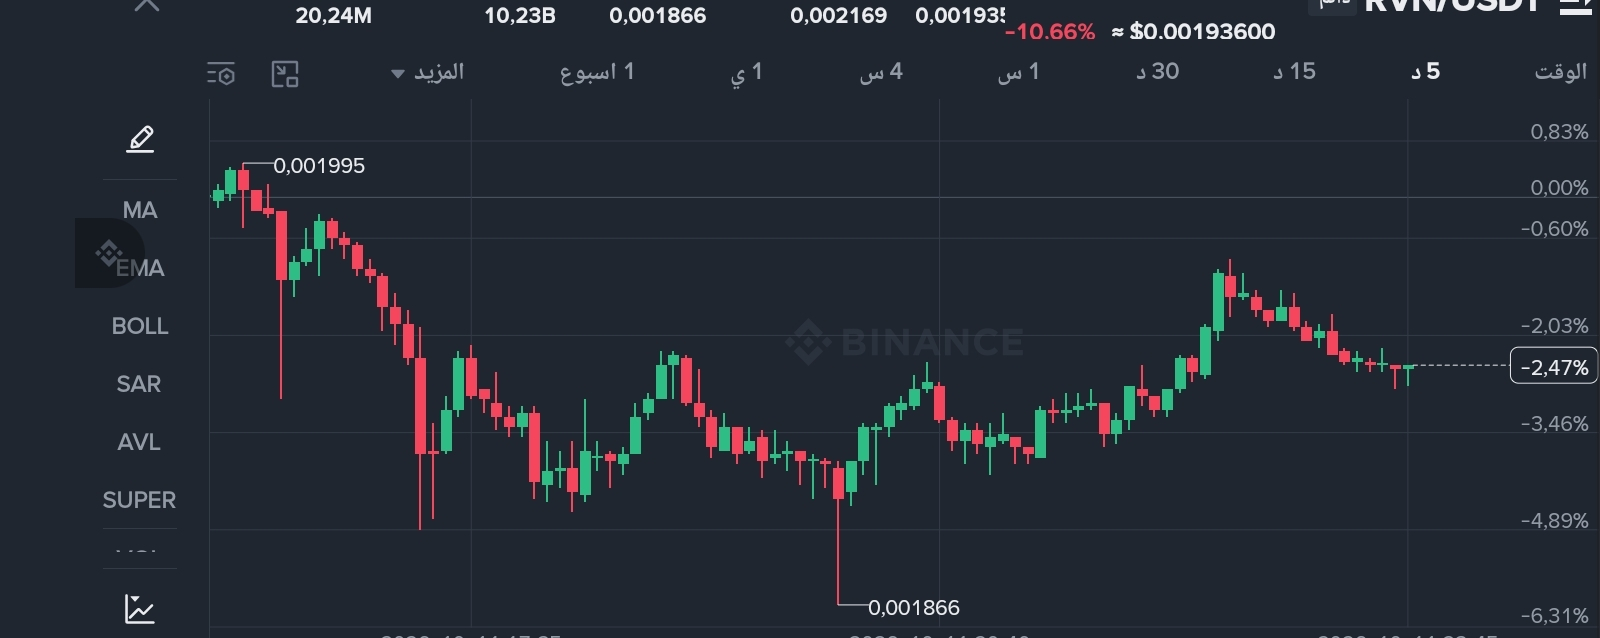

📊 Comprehensive and detailed analysis of $RVN / USDT (perpetual contracts) 📉🔍
RVN has seen sharp and significant price movements across various time frames. Here is a complete technical breakdown to help you read the chart accurately:
1️⃣ Key data and market overview (24 hours):
• Current price: Between $0.001930 and $0.001936.
• Percentage change: Down between -10.66% and -10.98%.
• 24-hour trading range: The high was $0.002169, while the low (current bottom) was $0.001866.
• Trading volume: The coin's trading volume is approximately 10.23B RVN, equivalent to around 20.24M USDT, reflecting notable activity in traded liquidity.
2️⃣ Analysis of different timeframes:
• Weekly timeframe (1 Week - long-term timeframe): The overall trend is steeply and persistently bearish over the long term. The coin has fallen from a previous high of $0.02443 to the current low near $0.001866, marking a historic decline of more than 90%. This indicates that strong accumulation on higher timeframes has not yet occurred.
• Hourly timeframe (1 Hour - medium-term): A continued downtrend from the latest local high of $0.002370, accompanied by consecutive red candles and very weak rebound attempts that have failed to break through resistance.
• Intraday timeframe (15-minute and 5-minute - scalping timeframe): A clear, pivotal low formed at $0.001866, from which the price temporarily rebounded toward $0.001995 before returning to subdued fluctuation with a slight sideways bias.
3️⃣ Key support and resistance levels:
• Main and vital support: At $0.001866 (a break below this level could trigger a new freefall into unjustifiably low territory).
• First resistance (short-term): in the $0.001995–$0.002065 range.
• Second resistance: At $0.002370.
💡 Conclusion: Extreme caution is required, given the dominance of the downtrend on higher timeframes. Carefully monitor the price action around intraday support levels.
#Binance #RVN #CryptoAnalysis #Trading #Crypto