

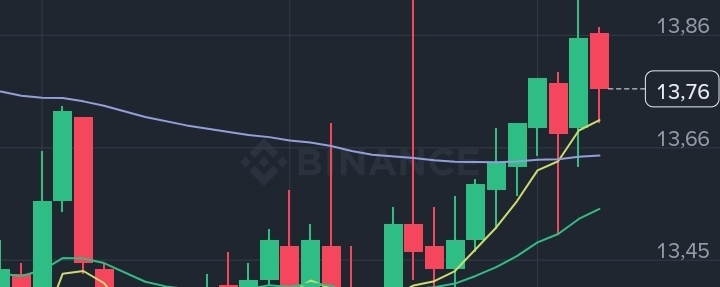

Connecting multiple timeframes (Multi-Timeframe Analysis) is one of the most powerful methods for identifying precise entry prices and reducing risk. The higher timeframe acts as a “compass,” showing the overall trend, while the lower timeframe acts as a “microscope” for executing the trade.
Based on the attached charts for NMR/USDT, here’s a professional approach to combining the 4-hour, 1-hour, and 15-minute timeframes to identify the best entry price:
1. 4-hour chart (the big picture and trend)
Purpose: Identify the currency’s overall trend (uptrend or downtrend) and key support and resistance levels.
Analysis of the first chart: The currency appears to have been in a sharp corrective downtrend from around $18.02 to a low of $12.86. We can see the price beginning to stabilize, with small green candles appearing and the MACD indicator starting to curve upward. This means the decline is beginning to weaken, and the price is moving toward stabilization or a bullish rebound.
2. 1-hour chart (confirming the reversal and preparing the zone)
Purpose: Monitor changes in price action and look for liquidity zones or chart patterns.
Analysis of the second chart: We can clearly see the price break above a previous minor high and turn into a minor uptrend (forming higher highs and higher lows), with the price rising from $13.10 to $14.01. The moving average lines (EMA 7 and EMA 25) have started to cross upward, and the MACD indicator has moved into positive territory (above zero), confirming that current momentum is bullish.
3. 15-minute chart (precise timing and pinpointing the price)
Purpose: Precisely identify the entry point (trigger) based on a retest or minor pullbacks, to avoid buying at the top.
Analysis of the third chart: After rising to around $13.94, the price began to pull back amid some minor profit-taking (red candles). The current price is $13.76.
📥 How to combine the readings to identify the "best entry price":
For a safer entry, we apply the rule "wait for a pullback in an uptrend":
Monitor support levels on the 15-minute chart: The best entry price is never during a surge of green candles, but rather when the price pulls back and tests the moving averages or previous lows.
Suggested entry zone based on the available data:
First level (moderate risk): Between $13.65 and $13.70. This is where the EMA 25 and EMA 7 overlap on the 1-hour and 15-minute charts, forming nearby support from which the price may rebound directly.
Second level (ideal and safer entry): If a deeper pullback occurs toward $13.45–$13.50, this is the previous higher low on the 1-hour chart and a test of the EMA 99 on the 15-minute chart. Entering here offers the best risk-to-reward ratio.
Safety valve (stop-loss - SL): Always place it below the last major low formed on the 1-hour chart—that is, if the price closes below the $13.10–$13.25 levels—to ensure you exit if the bullish scenario fails and the market reverses.