

$MAGIC This afternoon, a 15-minute candlestick dropped 22 points. If you had gone long with $200, you would have lost dozens of dollars. Why do small-cap stocks fall so quickly? One important reason is that there isn’t enough depth in the order book to absorb selling pressure from large investors.
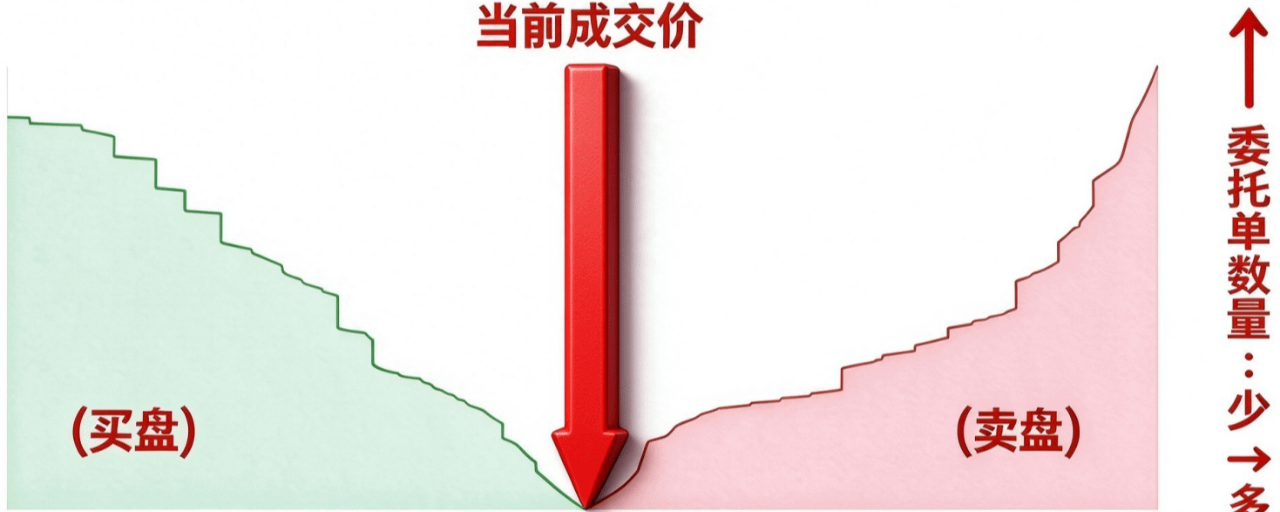
Candlesticks record historical prices at which trades have already been executed. The TLV depth chart, on the other hand, shows limit orders that have not yet been filled and are waiting in the order book. Simply put: candlesticks show past price movements, while the depth chart shows the current buy and sell orders in the order book.

Open Magic’s depth chart (location: on the candlestick chart, to the right of the pending orders, in the order book):
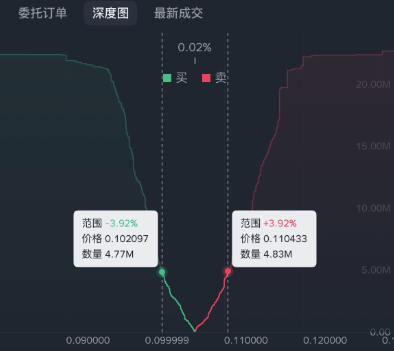
You can see the green area (buy-side information), the red area (sell-side information), the numbers on the horizontal axis (price changes), and the numbers on the vertical axis (changes in order volume).
The point where the red and green lines intersect is the current price of magic.
Press and hold the chart, then drag left or right to bring up two vertical white dashed lines (showing the exact order volume at a given price).
You can see that for magic to rise by ±3.92%, the order volume is only 4.7M, equivalent to about $480,000. In other words, $480,000 could push the price down by nearly 4%.
Drag the white dashed lines around and you’ll see how much support magic has at specific price levels. Overall, magic has very weak support, because there’s no staircase-shaped pattern like the one below.
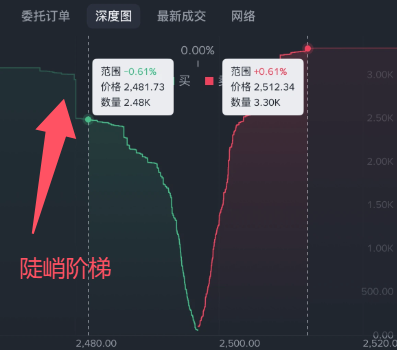
This is the ETH depth chart. You can see that at the -0.61% level, there are 2.48K ETH, worth about $6.15 million. In other words, a 0.6% drop would require $6.15 million in sell orders.
At the arrow in the image, there’s a steep vertical step, indicating that the order volume surges at a slightly lower price. --- This is where large buy orders are absorbing the selling. Likewise, a steep step in the red line indicates sell orders creating selling pressure.

The purpose of a depth chart is to help us see momentary selling pressure, how buy orders absorb sell orders, and the limit orders placed by large traders.
The trap of a depth chart: large traders can cancel their limit orders at any time depending on market movements.
All we can determine is how liquid this stock is at this moment, and how much selling pressure there is.
If liquidity is poor, you need to consider whether you can withstand the volatility and slippage when placing an order.
Small-cap coins come with built-in leverage, so be sure to watch your position size when trading them.