



#NEAR is trading at approximately $5.141, up 8.30% over the displayed 24-hour period. The 4-hour chart shows a recovery after a sharp decline, but the price is now approaching an area where sellers could become active again. Follow these instructions to get profit. 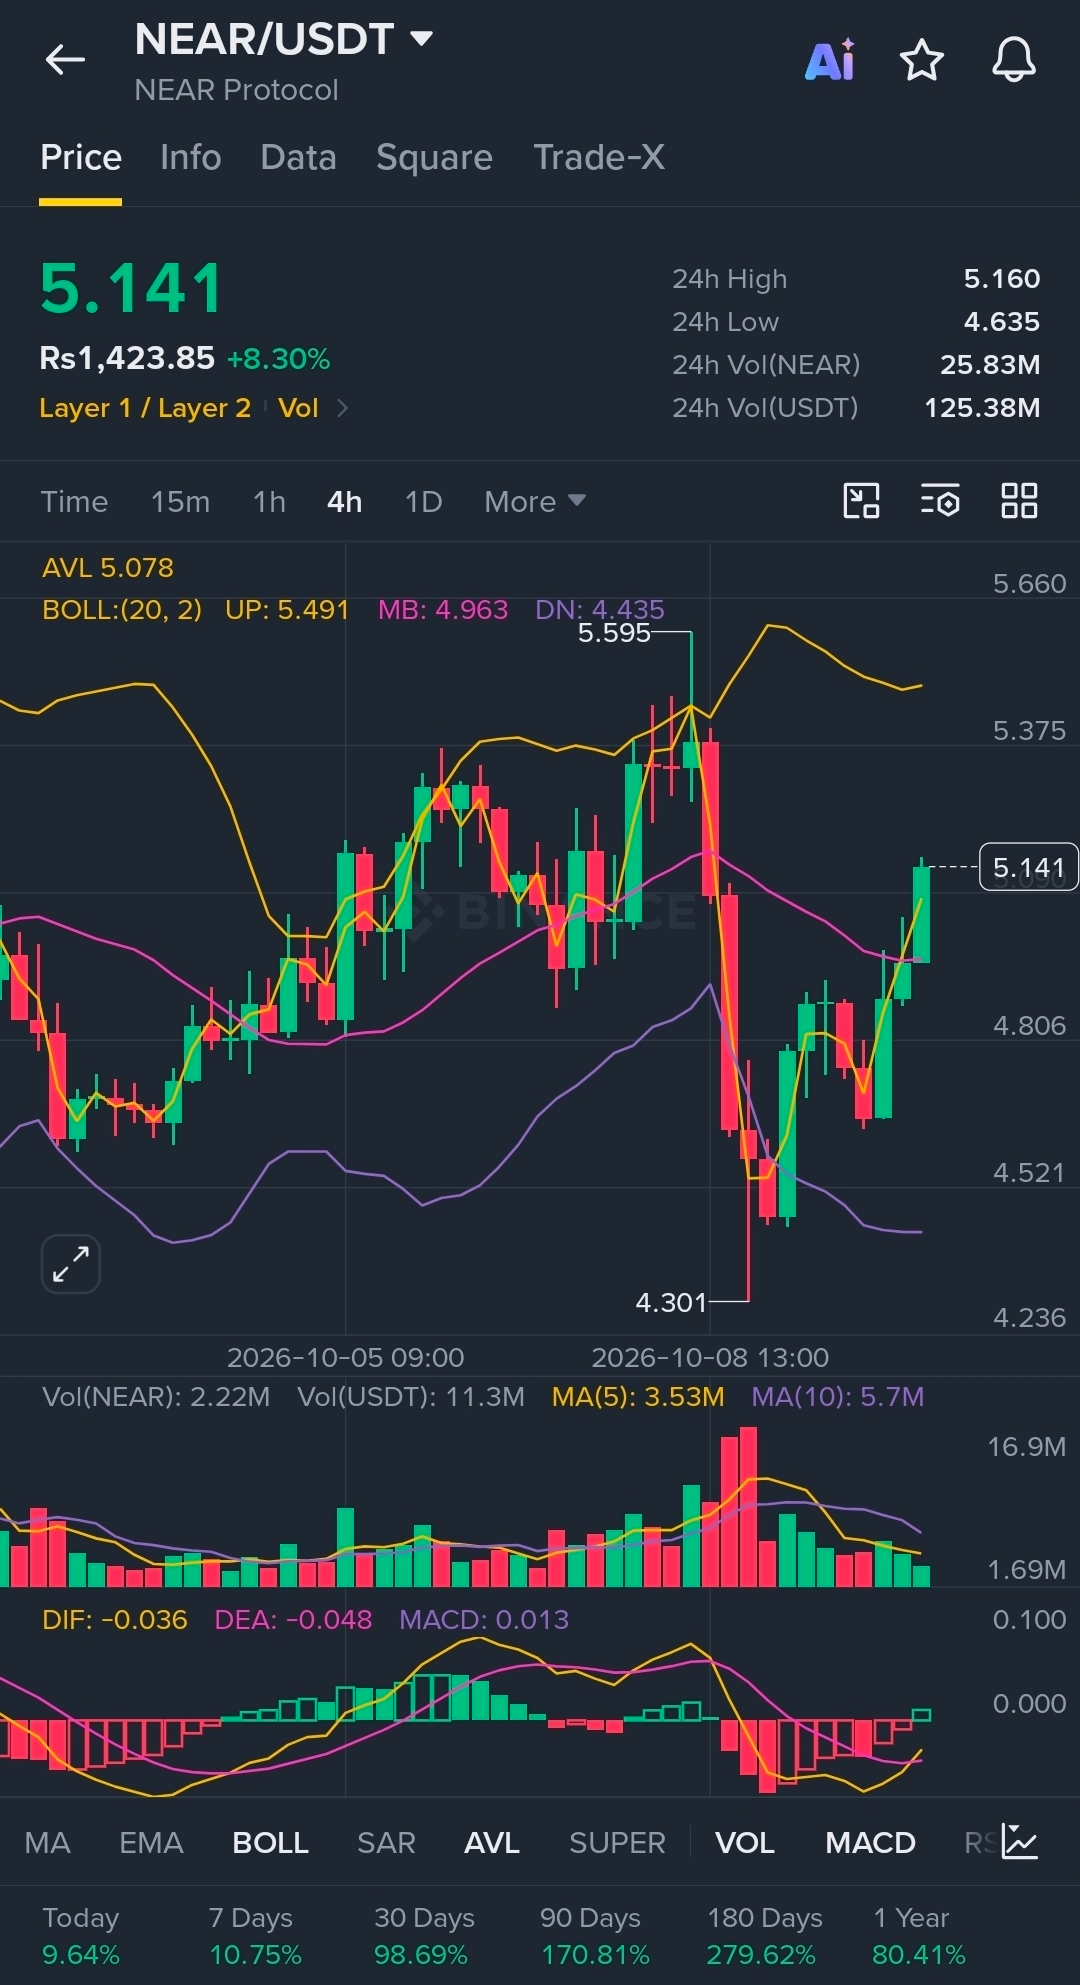
My initial view is that NEAR is showing a possible buying opportunity, but I would not consider this a confirmed breakout yet. The next few 4-hour candles are important.
➡️ Important support and resistance levels:-
The following levels are based on the price action and indicators visible in the chart. They are technical reference points, not guaranteed turning points.
👉🏻 Resistance 3: $5.49–$5.60
Upper Bollinger Band and previous swing high area
👉🏻 Resistance 2: $5.35–$5.40
Potential selling pressure before the upper band
👉🏻 Current price: $5.141
Near the recent recovery high of $5.160
👉🏻 Support 1: $4.96–$5.00
Middle Bollinger Band and potential retest area
👉🏻 Support 2: $4.80–$4.85
Nearby price structure from the recovery
👉🏻 Major support zone: $4.43–$4.65
Lower Bollinger Band and recent price lows
The most important level right now is around $5.00. If #NEAR returns to this area and buyers defend it, the price could establish a stronger base for another upward move.
On the other hand, a rejection near $5.35–$5.50 could bring another pullback. A move below $4.80 would weaken the short-term recovery, while a fall below $4.43 would raise the risk of a deeper decline.
➡️ This chart displays the following Bollinger Band values.
👉🏻 Indicator and price:-
Upper band: $5.491
Middle band: $4.963
Lower band: $4.435
#NEAR is trading above the middle band, which is a positive short-term sign. It suggests that buyers have recovered some control after the sharp decline. However, the price is moving toward the upper band. This area can act as resistance during a recovery, although touching the upper band does not automatically mean that the price must fall.
👉🏻 In my observation, buying immediately at $5.141 offers less attractive entry positioning than waiting for a successful retest near $5.00 or a confirmed breakout above resistance.
➡️ Volume analysis:-
The volume bars show a significant increase in activity during the sharp decline. This suggests that the sell-off attracted substantial trading interest. The subsequent recovery is encouraging, but the volume on the latest green candles appears less impressive than the volume during the earlier sharp moves.
➡️ For a stronger bullish confirmation, I would want to see:
👉🏻 A 4-hour candle closing above $5.16.
👉🏻 Increasing volume during the breakout.
👉🏻 The price holding above the breakout level on a subsequent retest.
Without these conditions, the current upward move could still be a temporary recovery within a wider correction.
➡️ Is NEAR Protocol a good project for spot holding?
#NEAR Protocol is a Layer 1 blockchain designed to support decentralized applications, scalable transactions, and a developer-friendly ecosystem. Its technology includes Nightshade sharding, which is intended to help the network scale.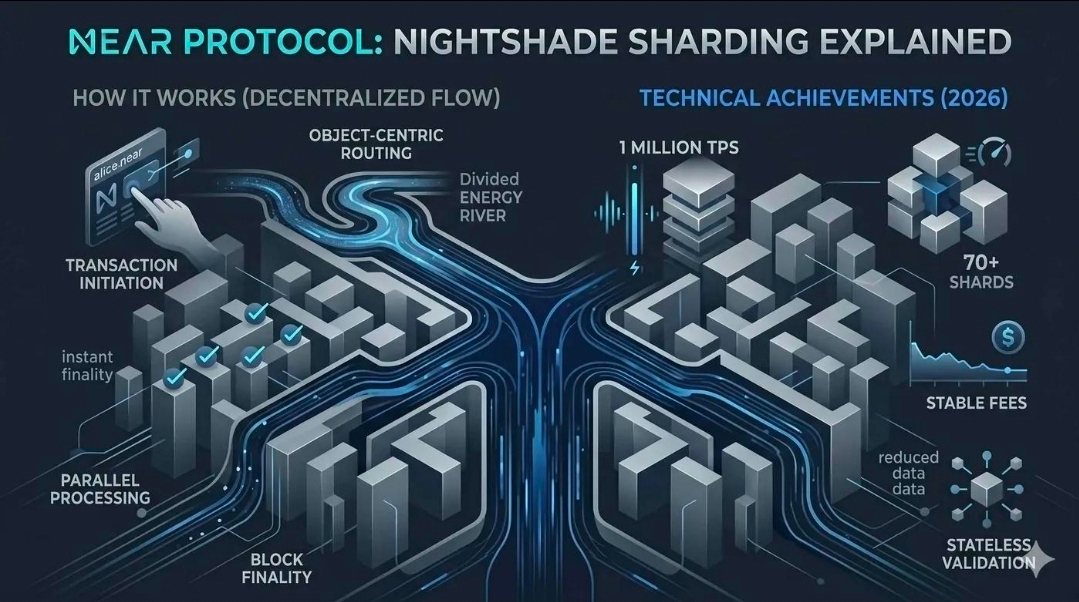
One area worth watching is NEAR Intents, which focuses on making cross-chain transactions and asset exchanges easier. The project is also developing infrastructure around AI agents and cross-chain financial activity. These developments give NEAR a broader use case than simply being a token traded on exchanges. However, a promising technology does not automatically mean that its token price will rise.
👉🏻 For a long-term spot investor, I would pay attention to three things:
* Real adoption: Whether users and applications are actually using the network.
* Token demand: Whether network activity creates meaningful demand for NEAR.
* Supply and token economics: Whether issuance, staking rewards, and token distribution support sustainable value.
The project has a credible technological direction, but competition from other smart-contract blockchains remains an important risk.
➡️ My spot buying strategy:-
If I were evaluating this chart for a spot entry, I would consider two possible setups rather than buying the entire position at once.
👉🏻 Setup A — Buy a confirmed retest
Watch the $4.96–$5.00 area. If the price pulls back, holds this zone, and produces a convincing bullish 4-hour candle, it may offer a more favorable entry.
👉🏻 Setup B — Buy after a breakout
Wait for a strong 4-hour close above $5.16, preferably followed by a successful retest. The next resistance area is around $5.35–$5.49.
➡️ What I would avoid?
Buying a full position immediately after a sharp recovery, particularly if the price is approaching resistance without a clear increase in buying volume. For either setup, decide in advance where the trade idea would be invalidated. Position size should be based on that risk, not simply on how much the coin might rise.
👉🏻 Final verdict:-
* Wait for confirmation
* Cautiously bullish
The 4-hour chart shows a meaningful recovery, a positive MACD histogram, and a price above the middle Bollinger Band. These are encouraging signs for a spot buyer. However, the price is close to immediate resistance, and the recovery still needs stronger volume and confirmation.
My preference would be to wait for a retest around $5.00 or a confirmed breakout above $5.16 rather than chase the current candle.
Note: This analysis is based only on technical indicators and my observations. It isn't a financial advice. Always do your own research before making any investment decisions.

