



From shrinking advances to new highs to a weak retest after the breakout
Prices are still making new highs, but each time they advance only a little beyond the last. Is this just a temporary pause, or is the rally starting to lose steam?
After reading the last few case studies in Chapter 3, I want to clarify one distinction: a rally that can't get far is a warning sign; stronger bearish evidence comes when selling pressure pushes the price down and the rebound can't reclaim former support. First, let's look at this stretch of BTC.#BTC
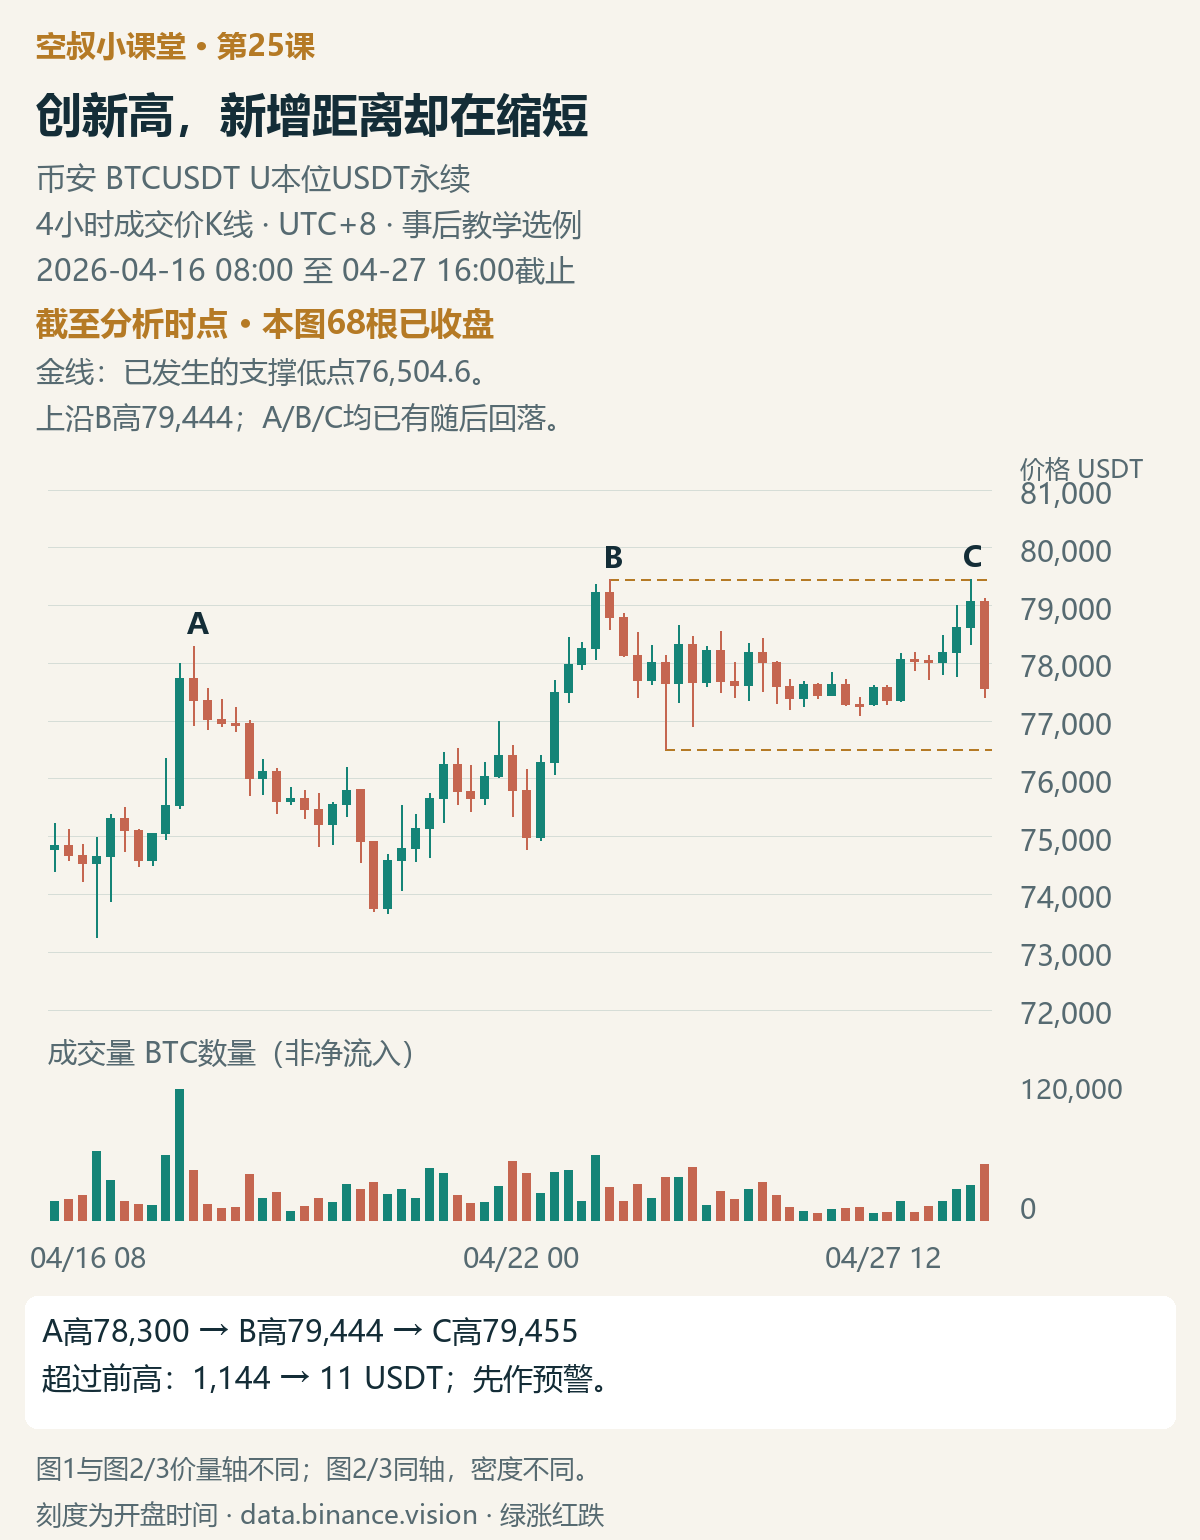
Figure 1 | As of 2026-04-27 16:00, 68 completed 4-hour candles; UTC+8. A retrospective example selected for instructional purposes
A reached a high of 78,300, B 79,444, and C 79,455. B rose 1,144 USDT beyond A, while C rose only 11 USDT beyond B. A sharp pullback followed C, and the new high did not hold.
This lesson follows one question: what evidence needs to be in place between “the rise is struggling” and “a short position may be worth considering”?
When a new high goes nowhere, treat it first as a warning
The original book calls the progressively smaller distance by which price breaks above previous highs SOT, or “shortening of thrust.” It compares the additional distance between consecutive highs, not whether each bullish candle's body is shorter than the last or whether the rise is taking less and less time.
It signals that advancing upward is becoming harder. This could be due to reduced demand, or stronger supply offsetting buyers' efforts. Particularly near an established resistance area, we also need to consider volume and the price reaction to determine which side is changing the situation.
The upper boundary of the range is the area where the prior rise was held back. When price returns there, we need to test whether buyers can absorb the selling pressure, push price away from this area, and secure follow-through to the upside.
The original book's eighth item discusses a specific pattern of a rally that reverses: there is first a buying climax, a natural reaction, and a secondary test; then price rallies into resistance again on the right side, with relatively shorter candles and a sharp increase in volume, before returning to the range within the next 1–3 bars. “1–3 bars” is a condition specific to this pattern, not a countdown that applies to every breakout.
If there was no buying climax beforehand, the author also requires a long bearish candle—a SOW, or sign of weakness—after the rally and reversal, followed by a low-volume weak rebound as a test.
Returning to Figure 1, C's volume was only about 1.11 times that of the immediately preceding candle, which does not meet the criterion for a “breakout on a sharp increase in volume.” We can identify SOT here, but cannot conclude that the entire special pattern is present.
The pullback after C provided new information: volume was about 1.63 times C's, and price fell 1,508.4 USDT from open to close. Selling pressure near the upper boundary became more apparent, adding evidence of localized weakness; price still closed above the 76,504.6 support reference shown on the chart.
So, the assessment at the Figure 1 cutoff is: upward progress is losing momentum, and localized weakness has appeared at the upper boundary; do not keep chasing this new high as a healthy breakout. This is not yet enough to establish a short plan after a break of the ice; what is missing is evidence that support has given way and the rebound cannot reclaim it. If price moves back above the upper boundary and gets follow-through to the upside, this SOT warning will not have developed into evidence of distribution.
After the break of the ice, see whether the rebound can reclaim the former support
The original book compares support to an ice sheet and calls a move down through support “breaking the ice”; a retest is when price returns from below to test whether it can reclaim the former support.
The sequence given in items nine and ten and the chapter summary is: first, evidence that supply is pushing price down; then, see whether the rebound occurs on low volume and has limited upward progress. If the rebound cannot reclaim the former area, that supports the view that supply remains dominant, and a short opportunity may be considered in such a weak retest.
Here, a “no-demand retest” means demand was insufficient to push price effectively, not that there were no buy orders or no trading. Background and test must be considered together; not every low-volume rebound is a sell signal.
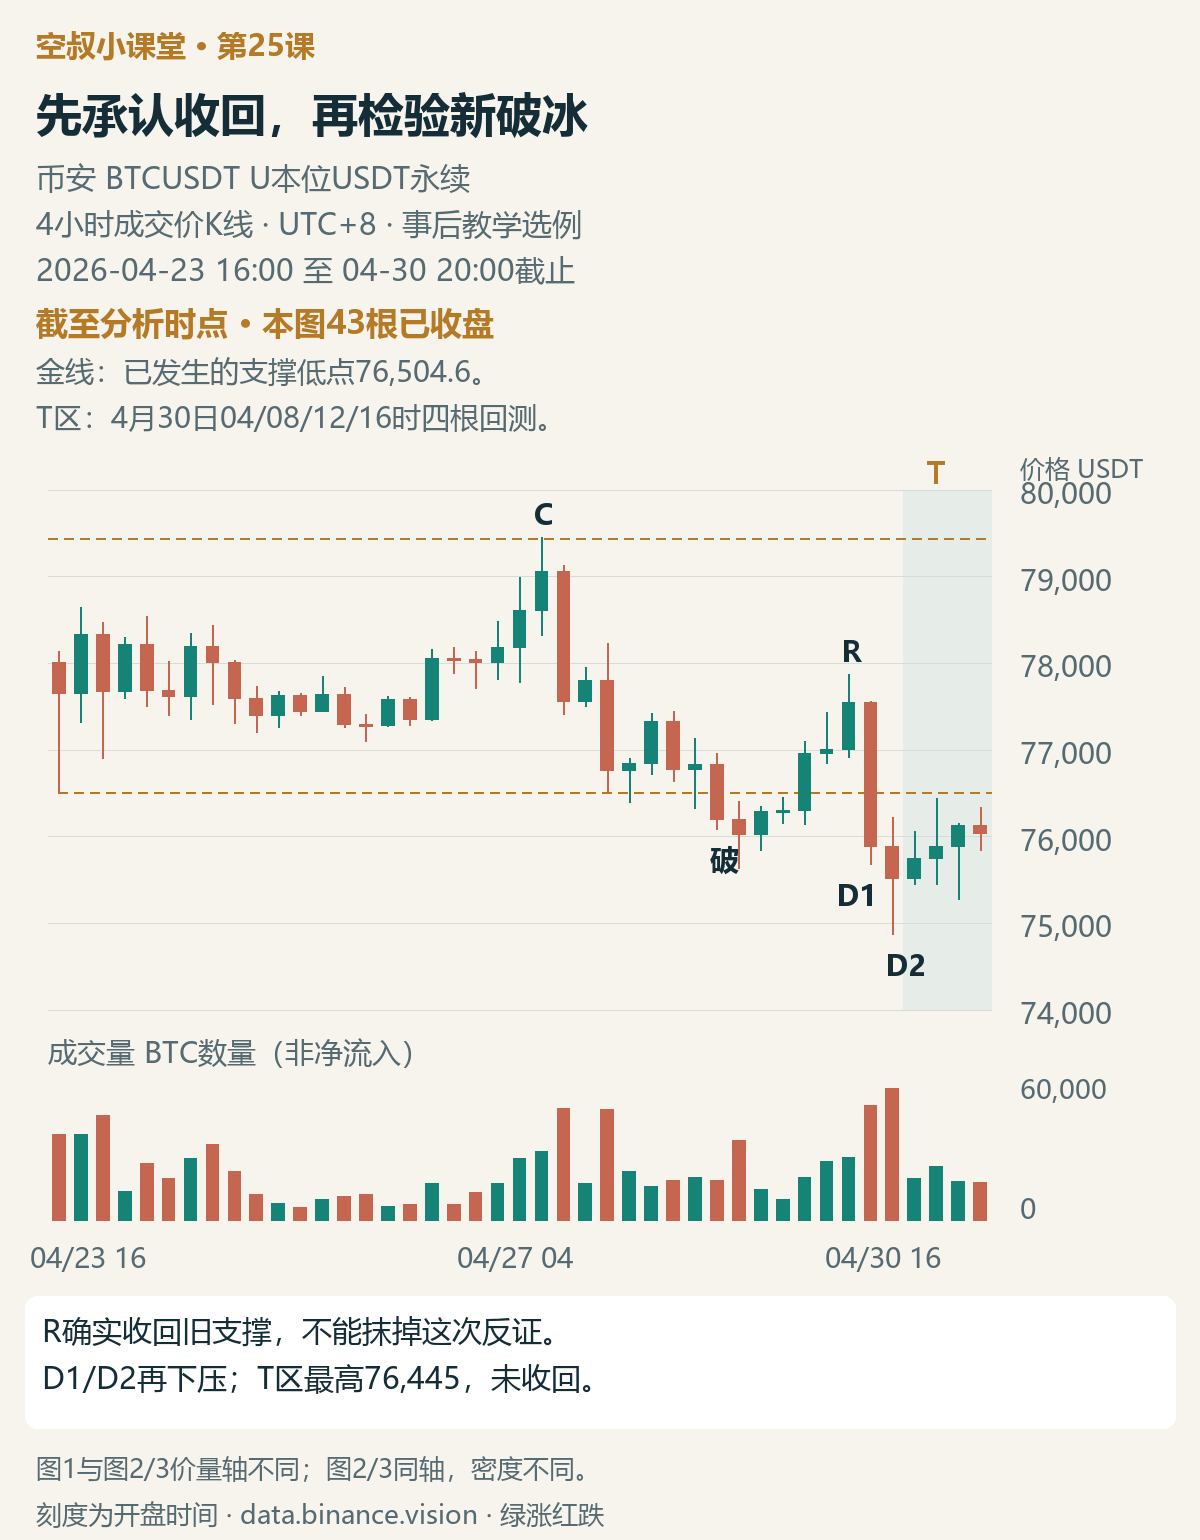
Figure 2 | As of 20:00 on April 30, the last 43 of 87 bars in the second node; Figure 1 price axis: 72,000–81,000, volume axis: 0–120,000; Figures 2/3 price axis: 74,000–80,000, volume axis: 0–60,000; different horizontal densities
In this example, 76,504.6 is the low made at 16:00 on April 23, and that candle had already closed back above it. We keep using this level to observe how subsequent support develops, rather than using later results to find a more convenient line.
At 16:00 on April 28, price first closed below it. It then rose again, reclaiming the level by 08:00 on April 29. At R, it closed at 77,552.5.
R shows that this break below support did not keep the former support pressing down on the rebound. A plan based on “the retest failing to reclaim the former area” should first be withdrawn and reassessed. The fact that price fell again later does not let us rewrite R as a weak retest that had already been confirmed at the time.
New evidence appeared after R. D1 and D2 both moved down sharply, closing at 75,889.1 and 75,518.5, respectively; D1's volume was about 1.85 times that of the preceding candle, and D2's was higher still. The increase in volume accompanied a downward move, and both candles closed below the former support, providing new evidence of a break of the ice and SOW.
The T zone that followed contains four candles. The rebound reached a high of only 76,445, without touching 76,504.6; each candle had less volume and a narrower high-low range than D1 and D2. The four candles did not close progressively higher, and the last one edged down. Buyers responded, but for now they have neither pushed far nor reclaimed the former support.
As of 20:00 on April 30, my main judgment on this 4-hour structure is: supply is dominant, and the weak retest after localized distribution supports a bearish view. The judgment is not based on SOT alone, but on D1 and D2 breaking support on increased volume, followed by a rebound in zone T on lower volume and with a smaller range; the high of 76,445 still failed to reclaim 76,504.6. Supply was able to push price down, while buyers failed to recover lost ground. That is enough to make the current judgment.
This judgment applies to this period of consolidation at elevated levels and the retest after the break of the ice; it should not be extended to mean that BTC's entire long-term trend has reversed. Distribution is the supply-and-demand explanation for this case; candlesticks cannot establish institutional identities or holdings.
In zone T, plan for localized bearishness
In terms of the plan, look for short opportunities in zone T as a weak retest after the break of the ice, rather than buying the dip as an ordinary pullback. The rationale for participating is the supply advantage already in evidence and the failure of the retest; there is no need to wait for the entire bear market to be confirmed.
The invalidation reference is also part of the same plan: if price reclaims 76,504.6 and then holds above it during the subsequent pullback, withdraw this localized bearish rationale. To count as “holding,” the pullback after the reclaim must find support; a brief intrabar move above the level is not enough to meet this condition.
The original book places the opportunity in the test after a sign of weakness; it does not universally require another break below the low of zone T for the setup to count. If your personal plan chooses to wait for another downward move before participating, that is an additional execution choice: it may provide another layer of supply evidence, but could also mean missing an earlier retest entry. Don't present this choice as a mandatory condition in the original book.
This is a conditional plan for a historical case, not a record of a trade that was executed. Whether to place an order requires a risk plan written in advance; existing positions should follow their predetermined exit conditions, and a stop-loss must not be delayed just to wait for structural invalidation. This lesson does not invent a limit price, stop distance, or bar-count rule.
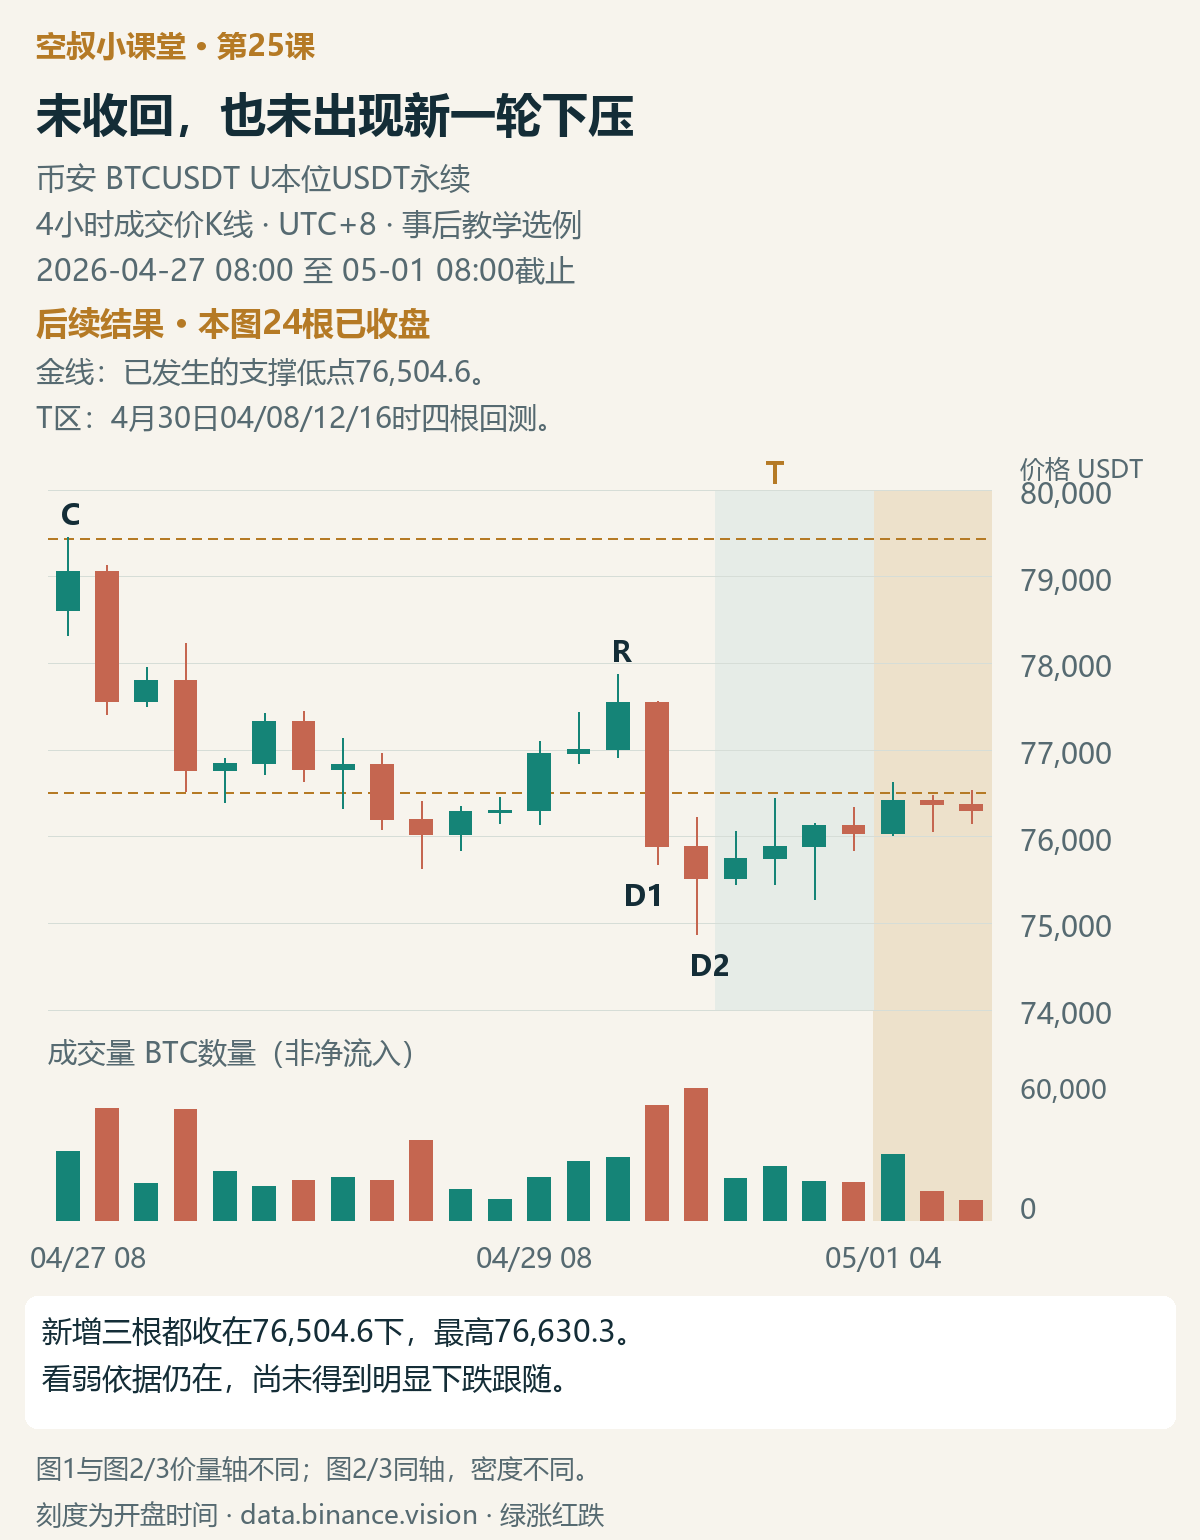
Figure 3 | Subsequent outcome through 08:00 on May 1, with 3 new bars added in the gold-shaded area; same price and volume axes as Figure 2, different horizontal density
The next three candles moved above 76,504.6 intrabar, but all closed below it; the last closed at 76,305.4. At the same time, there was no new sharp move down.
The assessment after the outcome is: the localized bearish view still holds, but the expected continuation downward has not yet materialized. All three candles closed below 76,504.6; there was no “reclaim and hold,” so there is no reason to change the main view to bullish. Price also did not continue sharply downward, so this cannot be reported as a short trade that has already worked out as expected.
The distinction here is important: the basis for zone T is the break of the ice and weak retest that had occurred by the cutoff; subsequent testing tells us whether this judgment is invalidated or plays out. Failure to play out does not mean the original evidence never existed, and not being invalidated yet does not mean the trade is bound to succeed.
My learning summary
SOT signals that pushing higher is becoming harder; the reaction at the upper boundary helps explain supply; the break of the ice shows support giving way; and the weak retest tests whether buyers can reclaim the former area. Only by connecting this evidence can we see how distribution gradually takes shape.
The new skill in this lesson is matching evidence to a clear judgment and plan: Figure 1 shows localized weakness at the upper boundary, so stop chasing the move as a healthy breakout; R reclaims the former support, so remove the reason for the short bias based on that instance of resistance; after D1 and D2, the weak retest in T supports a plan based on localized bearishness, with reclaiming 76,504.6 and holding above it as the invalidation reference. State the judgment only as far as the evidence goes.
A quick exercise
Using Figures 1 and 2, explain why the plan in zone T should be based on localized bearishness rather than simply saying “keep watching.” Why can't R be treated as a weak retest? What change would invalidate the bearish rationale in zone T? Has Figure 3 already overturned it?
Share your reasoning in the comments; don't just answer “up” or “down.” A sample analysis will be added to the comments on this post later.
Uncle Short is here to grow with you along the trading journey.