


Bitcoin price has recovered toward $83,000 after testing $80,400, but weakening daily momentum and a still-positive weekly breakout leave its October outlook dependent on holding the $79,600–$80,400 support zone.
Summary
$79,663 marks daily Supertrend support beneath Bitcoin’s rebound toward $83,000.
Daily MACD remains bearish, with its histogram falling to approximately negative 537.
Bitcoin’s weekly chart remains above the upper boundary of a falling wedge.
The liquidation heatmap shows a large concentration of leveraged positions near $87,000.
TradingView’s Binance BTC/USDT daily chart placed Bitcoin at $83,012 on Oct. 9, while the weekly chart showed $82,928. The weekly price was down 4.16%, following a high of $86,999 and a low of $80,394.
Bitcoin’s recovery has therefore reduced the distance from its recent highs without reversing the weekly decline. The charts present competing signals for the rest of October: short-term momentum has deteriorated, while the broader recovery from the summer lows remains intact.
Bitcoin’s $80,000 support faces its next test
On the daily TradingView chart, Bitcoin remained above its green Supertrend line at $79,663.52. The indicator still supports a bullish trend reading, although the recent decline has brought price closer to that threshold.
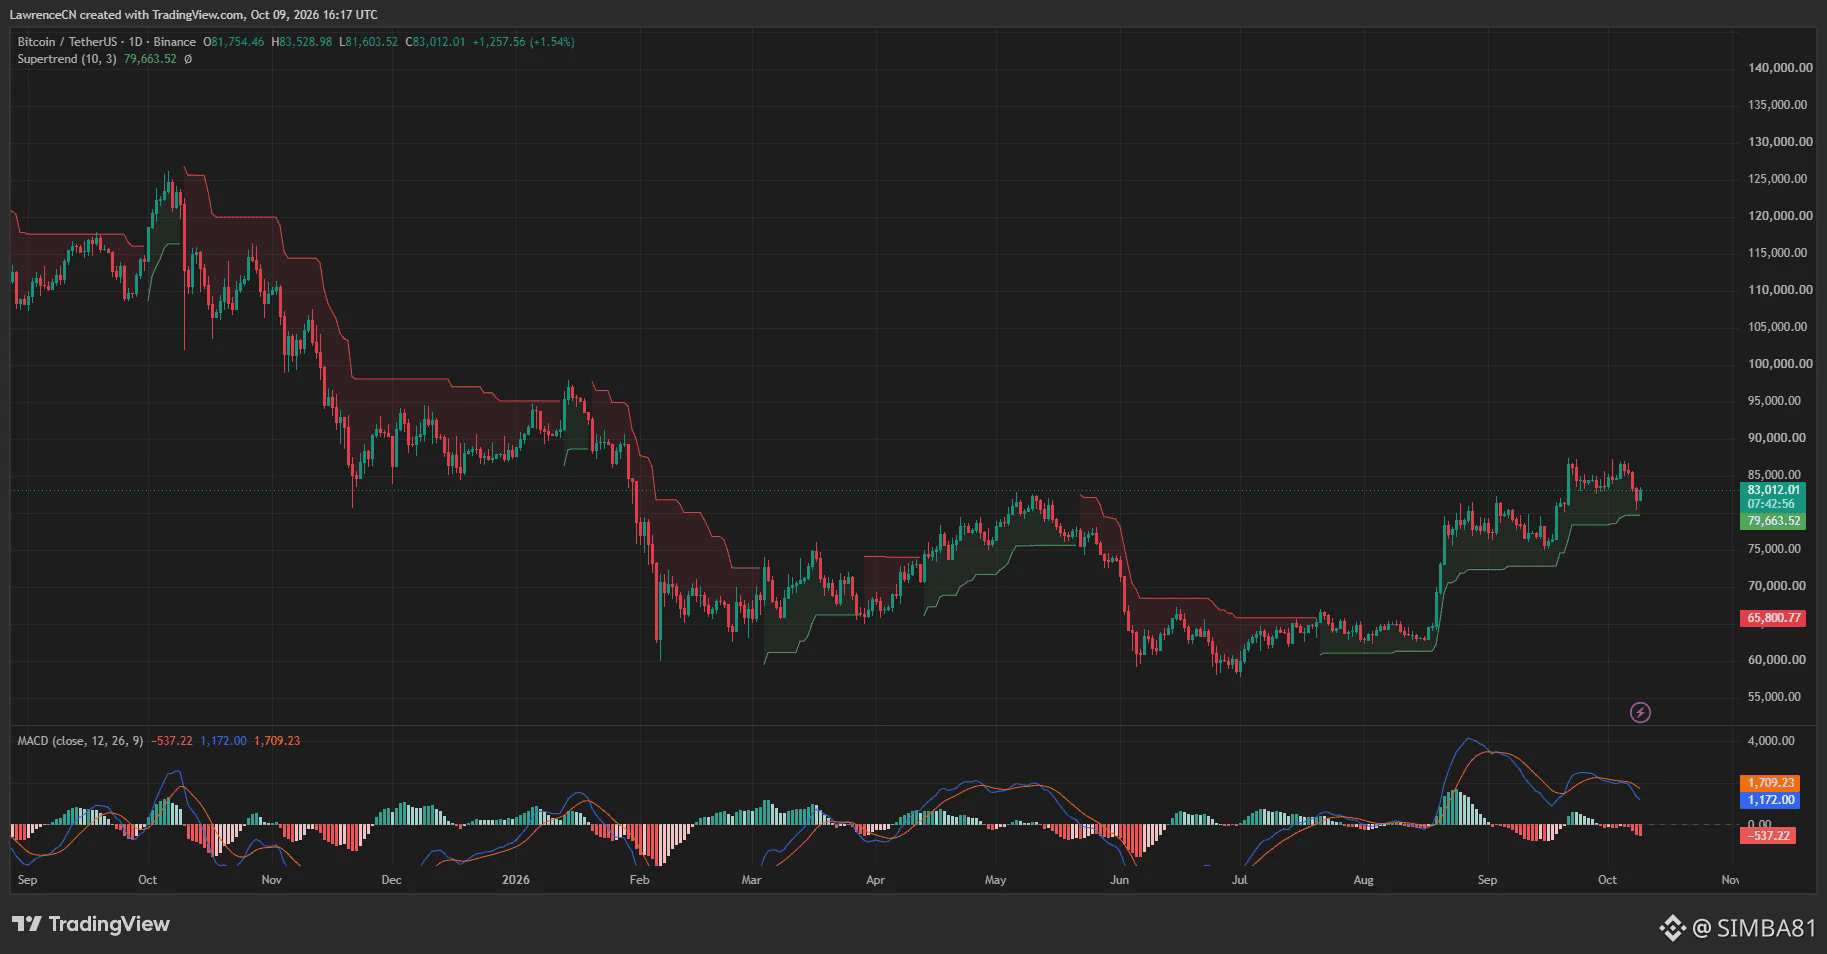
Together, the Supertrend reading and the weekly low identify approximately $79,600–$80,400 as the nearest major support area. A sustained move below that range would weaken the daily recovery structure and expose the earlier trading region around $75,000–$76,000.
The daily MACD offers a more cautious signal. Its blue line stood at 1,172, below the orange signal line at 1,709.23, while the histogram registered negative 537.22.
You might also like:Bitcoin could benefit from rising U.S. debt fears: CoinShares
The bearish crossover indicates that upward momentum has slowed despite Bitcoin’s rebound. Both MACD lines remained above zero, however, distinguishing the current loss of momentum from a fully negative reading across the indicator.
Based on those chart signals, another support test remains possible unless Bitcoin rebuilds momentum above the nearby resistance area. A recovery through $84,000–$85,000 would be an initial improvement, while the recent highs around $86,500–$87,000 represent the more important barrier.
The weekly breakout keeps a recovery scenario alive
Bitcoin’s weekly TradingView chart shows price above the upper boundary of a falling wedge drawn across the decline from its 2025 highs. The breakout occurred before the latest pullback, and the recent candles remain above that descending boundary.
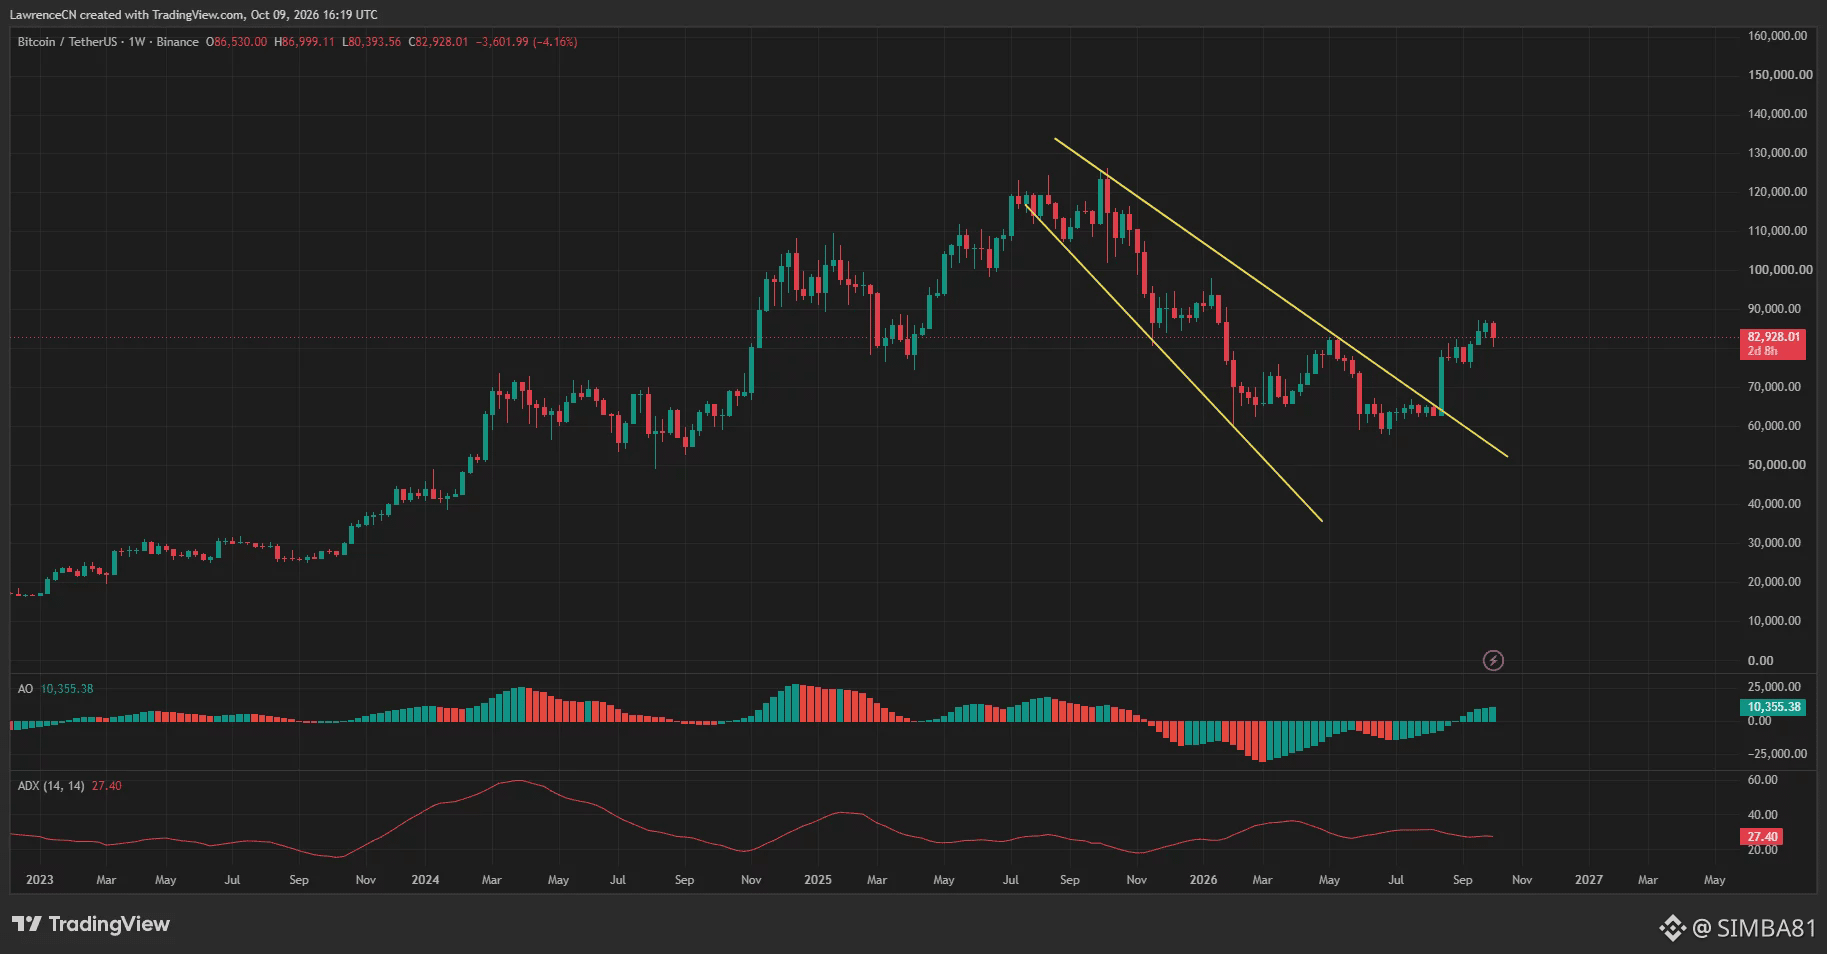
The weekly structure therefore still supports a conditional recovery scenario. The pullback has not yet returned Bitcoin inside the marked wedge, although remaining above the pattern alone does not establish a new upward move.
The weekly Awesome Oscillator stood at positive 10,355.38, with green bars above zero. Its reading contrasts with the bearish daily MACD and suggests that momentum remains stronger on the longer timeframe.
Weekly ADX registered 27.40. The reading indicates an established trend, but ADX measures strength rather than direction and cannot independently confirm that Bitcoin will rise.
Taken together, the weekly breakout and positive oscillator leave room for another attempt at $87,000 if nearby support holds. A sustained break above that recent high would strengthen the chart-based case for a move toward $90,000.
Repeated rejection below $87,000 would leave Bitcoin trading beneath the same ceiling that stopped its early-October advance. Under that scenario, the weekly recovery would need further consolidation before a clearer direction emerges.
Liquidation levels point to $85,000 and $87,000
CoinGlass’s one-week liquidation heatmap shows Bitcoin rebounding after a steep decline toward $80,400. At the right edge of the chart, leveraged positions remain concentrated above the price, including bands around $85,000 and $87,000.
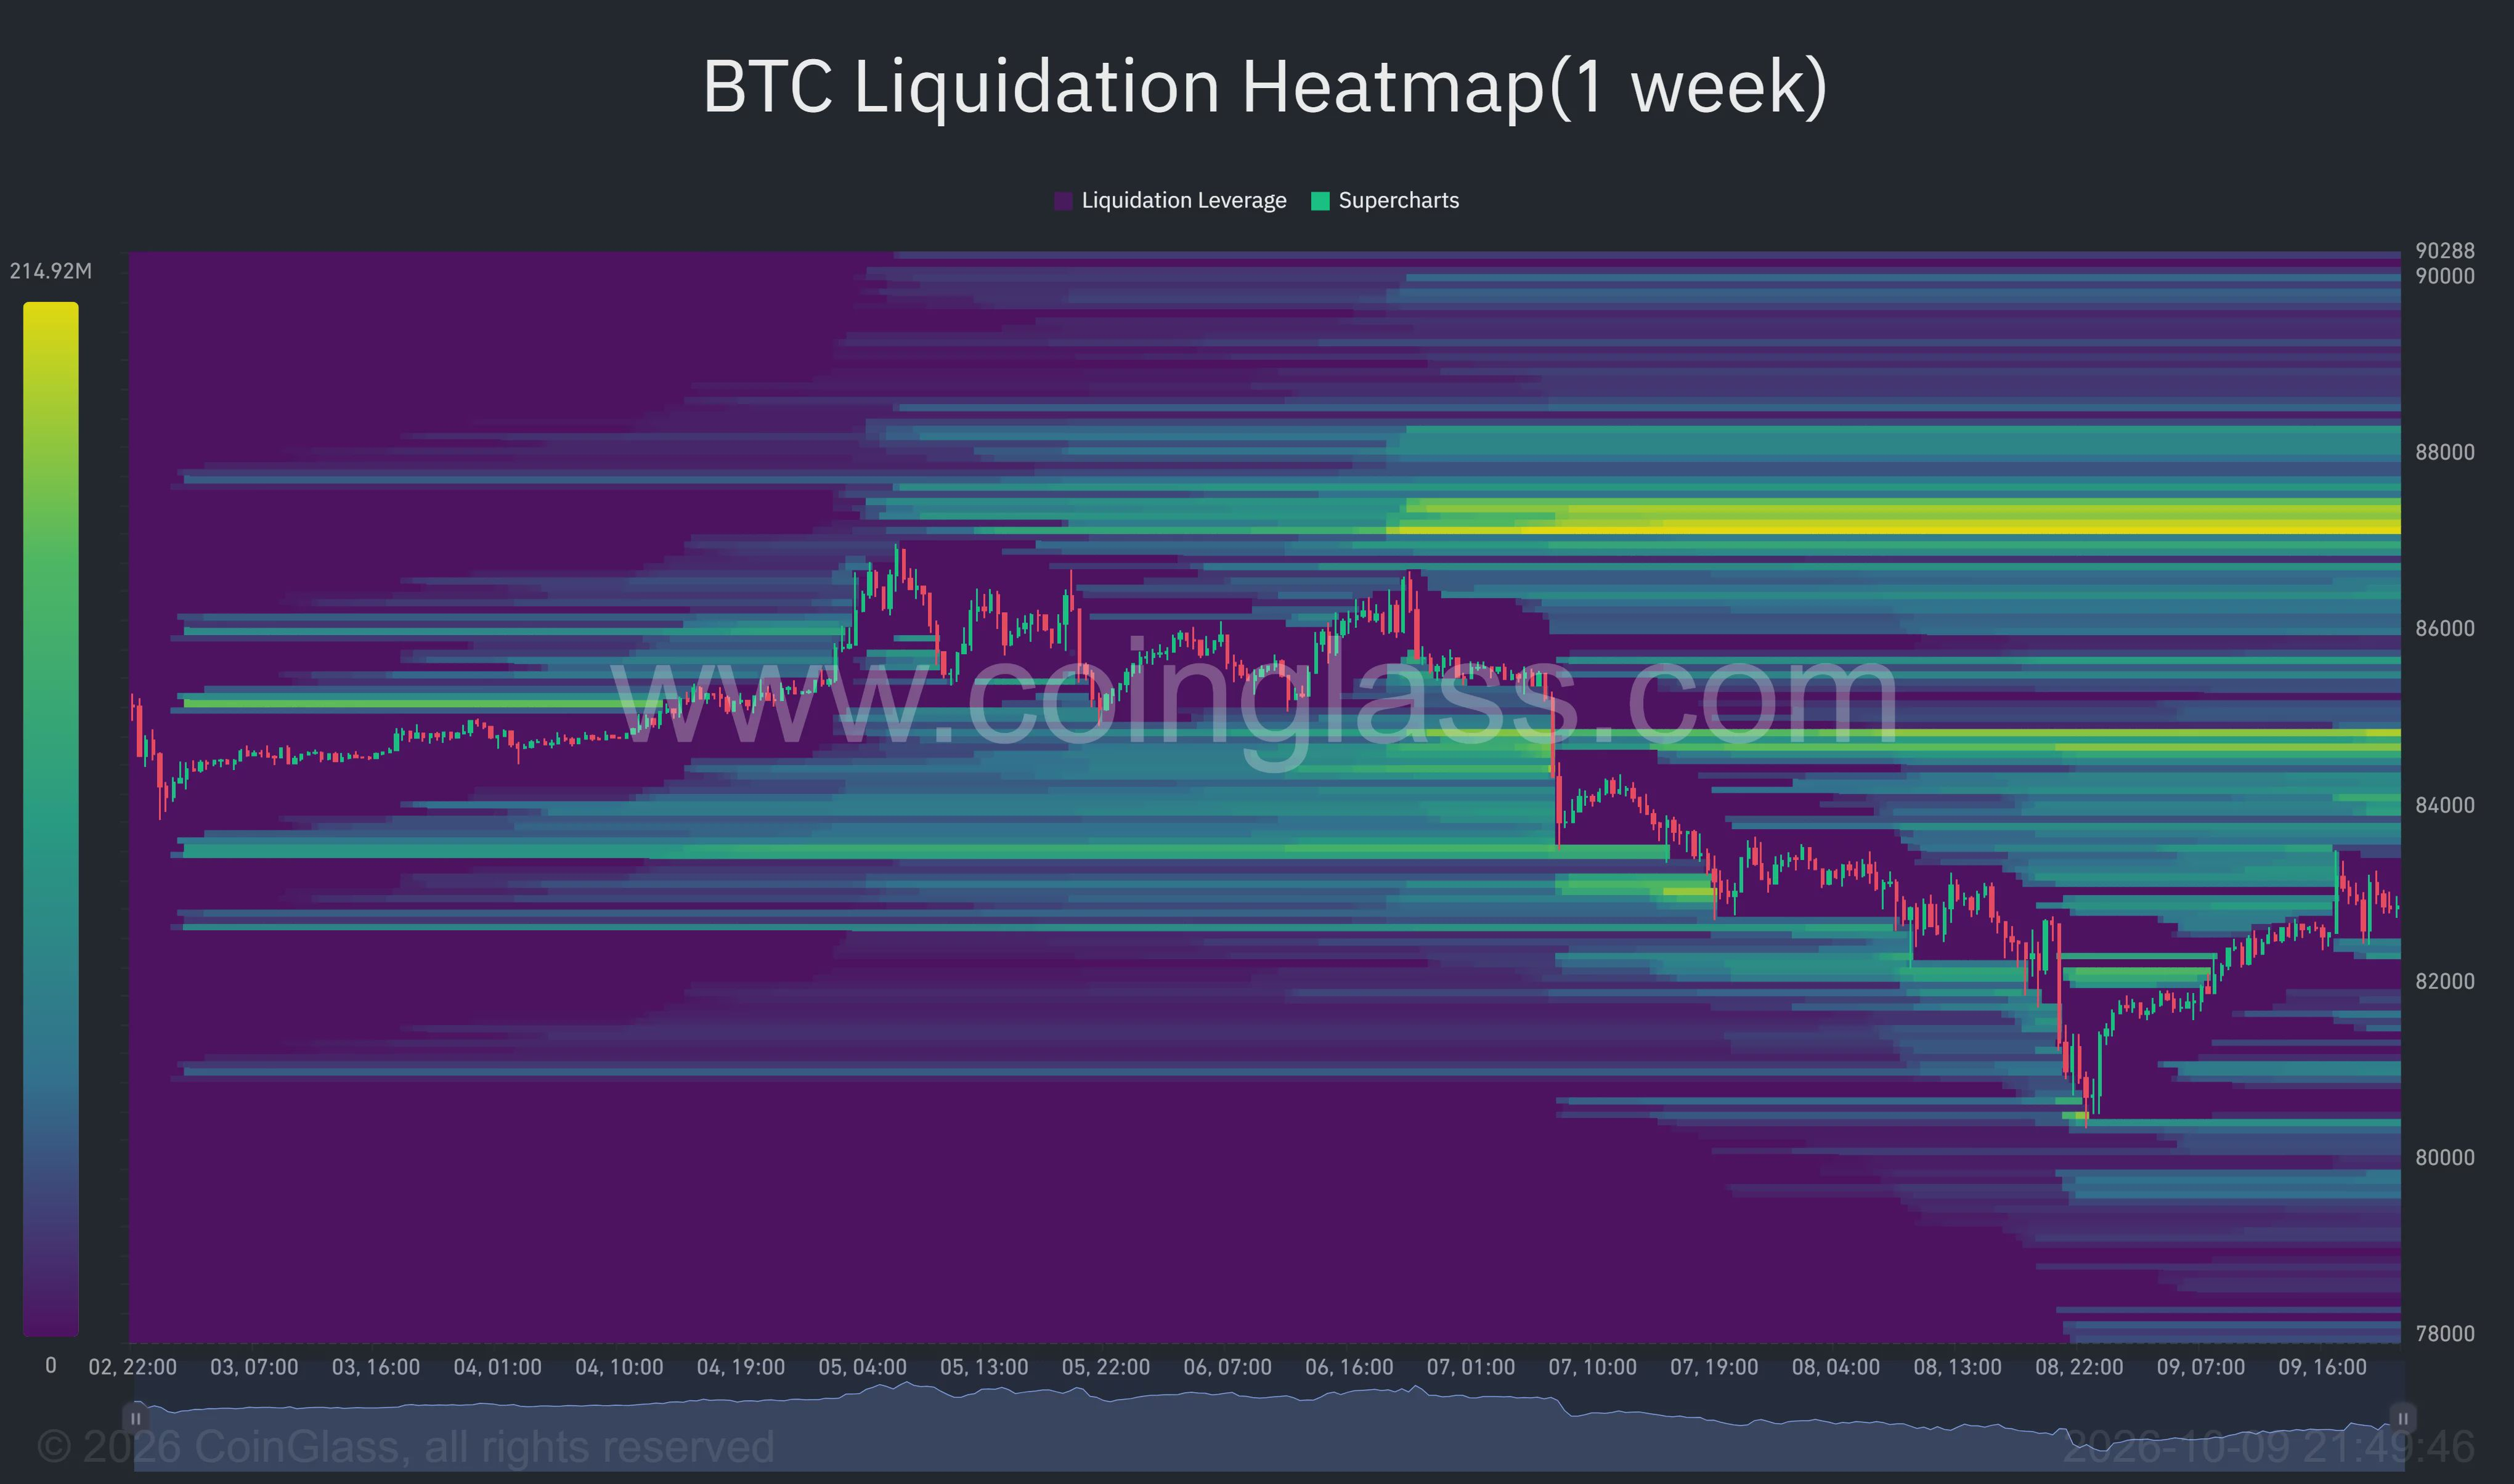
The brightest overhead band sits near $87,000. If Bitcoin advances into that region, closures of vulnerable short positions could amplify the move, although the heatmap cannot establish whether buyers will first drive price there.
Below the market, visible bands remain around $82,000 and $80,400. The positioning leaves room for volatility in either direction, particularly if Bitcoin loses the levels recovered during its latest bounce.
An Oct. 9 commentary post accompanying a CryptoQuant chart reported approximately 55,600 BTC moving to exchanges at a loss over 24 hours. The post interpreted the transfers as pressure on newer holders while acknowledging that exchange deposits do not necessarily represent completed sales.
The same commentary cited $1.09 billion in crypto liquidations, including approximately $1.05 billion in long positions. Those figures describe the reported market-wide event, rather than Bitcoin liquidations alone.
The exchange-transfer data adds a potential supply concern to the technical picture. It does not establish how much Bitcoin was sold or whether the holders behind those deposits will continue selling.
US policy remains an October catalyst
Government-linked wallet movements have added another supply concern. crypto.news reported approximately 833.6 BTC worth $71.56 million moving toward Coinbase Prime, with around 264.9 BTC tied to the Bitfinex case and 568.7 BTC linked to the Potapenko and Turogin forfeiture. The transfer raised sale questions rather than confirming a completed disposal.
The Federal Reserve’s September meeting minutes recorded a quarter-point increase to a 3.75%–4% policy range and scheduled the next meeting for Oct. 27–28. The minutes also described higher Treasury yields and oil-driven inflation pressures.
Reuters reported that most officials considered another increase appropriate by year-end, while investors expected an October pause and a December hike. An October increase therefore remains a risk rather than an established outcome.
For the remaining weeks of October, the chart-based outlook hinges on two zones: support around $79,600–$80,400 and resistance around $86,500–$87,000. Holding support and clearing resistance would strengthen the recovery case toward $90,000; losing support would shift attention toward $75,000–$76,000.
Disclosure: This article does not represent investment advice. The content and materials featured on this page are for educational purposes only.
Read more:Cardano price looks fragile below $0.24: Can it hold $0.21?
Read more about
BitcoinPrice Analysis
Cardano price looks fragile below $0.24: Can it hold $0.21?
By Lawrence Mondal
Oct 9, 2026 at 08:44 PM GMT+5
Edited by Lawrence Mondal
Markets
Share
Cardano price has fallen below $0.24 after reversing its early October rally, with weakening daily momentum and an analyst’s ascending-channel warning putting $0.21 back in focus.
Summary
Cardano price traded near $0.236, down about 9.2% from its weekly opening price.
Daily RSI fell to 48.06, while price slipped below the $0.2483 Bollinger midpoint.
Ali Martinez identified $0.21 as a possible downside level following an ascending-channel rejection.
Weekly Supertrend resistance stood at $0.2762, above ADA’s attempted recovery.
TradingView’s Binance ADA/USDT data showed Cardano trading at $0.2359 on Oct. 9, recovering modestly after a sharp sell-off. The daily session ranged between $0.2313 and $0.2415, with ADA up 1.59% from its opening price.
The rebound followed a much larger retreat from the weekly high. TradingView’s weekly chart recorded a high of $0.2824 and a low of $0.2238, leaving ADA near $0.2358 and down 9.2% against its weekly opening price.
Measured from the weekly high, Cardano had lost approximately 16.5%. Its bounce from the weekly low amounted to about 5.4%, leaving the recovery well short of the preceding decline.
You might also like:Cardano’s Hoskinson challenges Vitalik over AI threats to crypto
Cardano’s channel rejection puts $0.21 in focus
Analyst Ali Martinez identified a rejection at the upper boundary of an ascending channel on Cardano’s daily chart in an Oct. 8 post. His analysis placed the channel’s lower boundary near $0.21 and made a move toward that level conditional on the rejection holding.
The channel illustration marked intermediate levels near $0.23 and $0.256, with the upper region around $0.29. ADA’s subsequent move below $0.24 left it closer to the lower marked levels than to the area where the analyst identified the rejection.
A decline from $0.2359 to $0.21 would amount to roughly 11%. Before reaching that level, ADA would encounter the recent weekly low at $0.2238, an observable reference from the latest sell-off.
Jesse Olson also pointed to weakening daily momentum in an Oct. 9 post. He said Cardano had shown bearish divergence several days earlier and that a sell signal, together with a candle close below his trend dots, had preceded two targets being reached.
Olson identified a lower yellow zone as a possible retest area. His warning and Martinez’s channel analysis both described downside setups, although they used different chart tools and conditions.
A recovery above $0.24 would reverse the immediate loss of that price level. TradingView’s daily readings place another reference higher, near $0.2483, before ADA reaches the $0.256 region marked in Martinez’s chart.
Daily RSI slips below 50 as ADA loses its midpoint
TradingView’s daily chart showed Cardano’s relative strength index at 48.06, below the neutral 50 level. The RSI also sat beneath its displayed moving average of 59.88 after falling sharply from its early October readings.
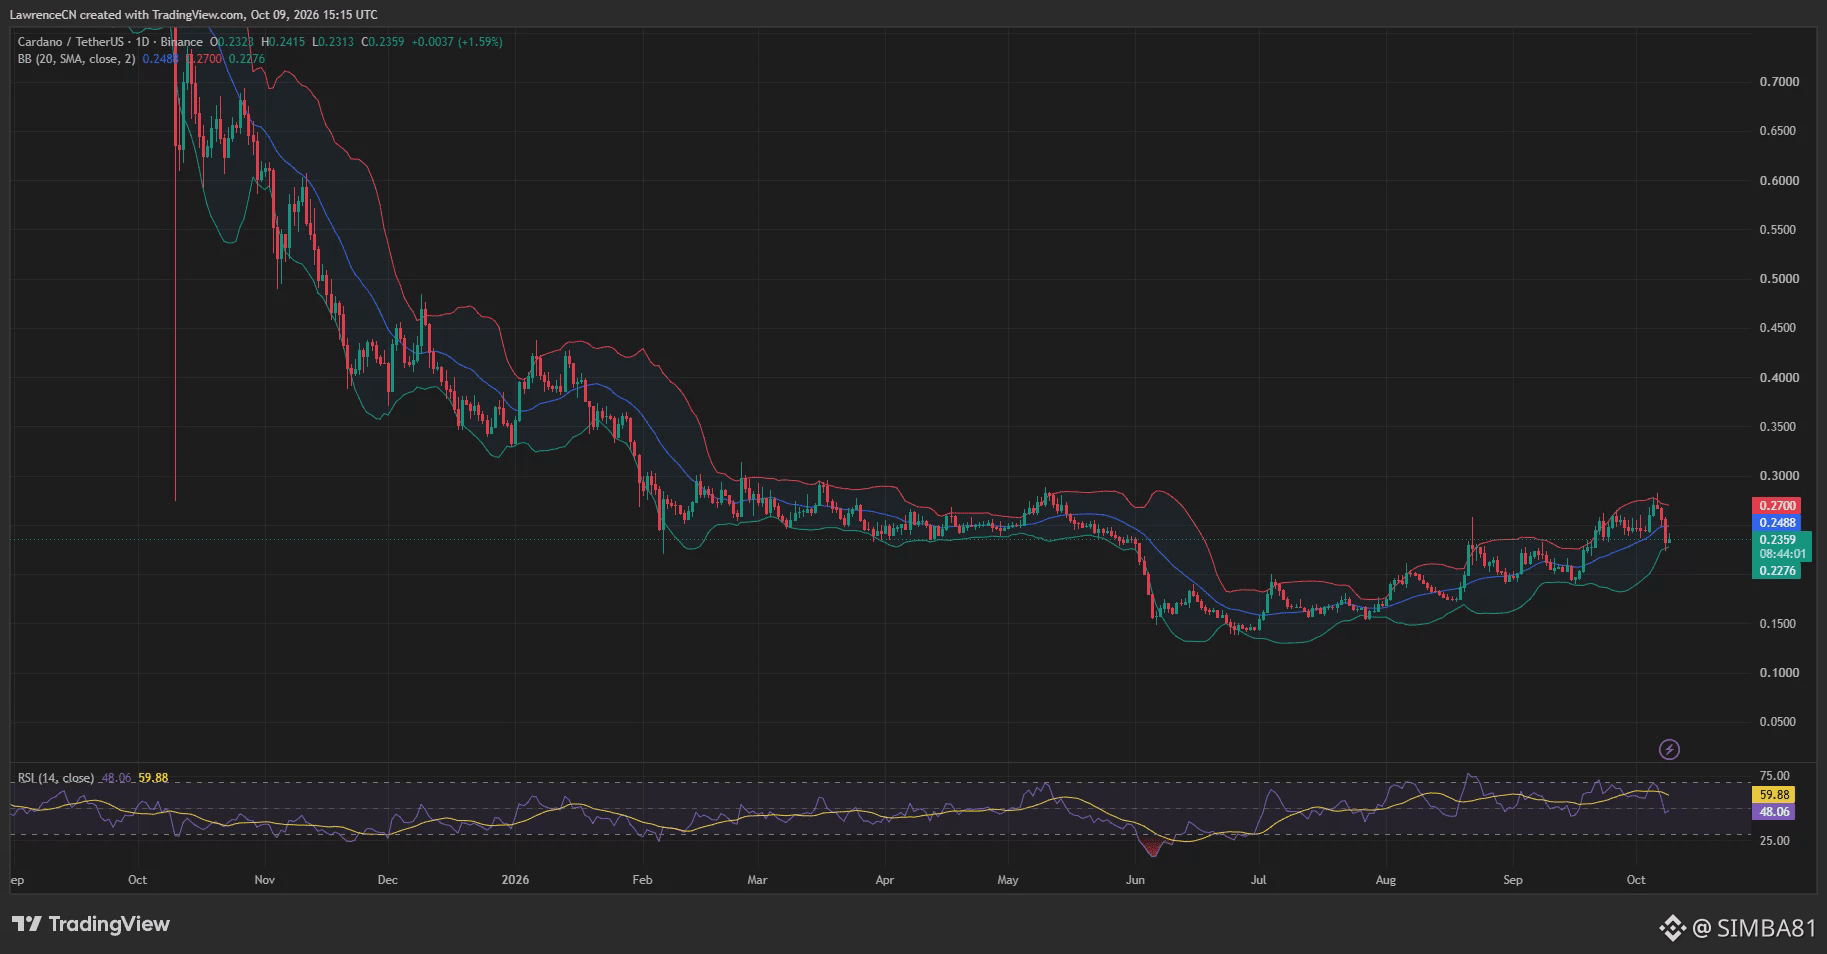
The daily Bollinger Bands placed the 20-day simple moving average at $0.2483, the upper band at $0.2700 and the lower band at $0.2276. ADA traded below the midpoint and approximately 3.6% above the lower band.
The midpoint stood around 5.3% above the latest price. A move back to that average would recover part of the recent decline, while the upper band remained approximately 14.5% higher.
On the downside, the lower Bollinger Band and the weekly low formed two nearby references at $0.2276 and $0.2238. Martinez’s $0.21 scenario lies below both.
The daily chart also showed that the latest retreat followed a recovery from the June lows, when ADA traded around $0.14–$0.15. Despite the October reversal, the price remained above that earlier trough.
Weekly resistance remains near $0.276
TradingView’s weekly Supertrend remained red at $0.2762, above Cardano’s latest price. The weekly high of $0.2824 briefly exceeded that level before ADA retreated beneath it.
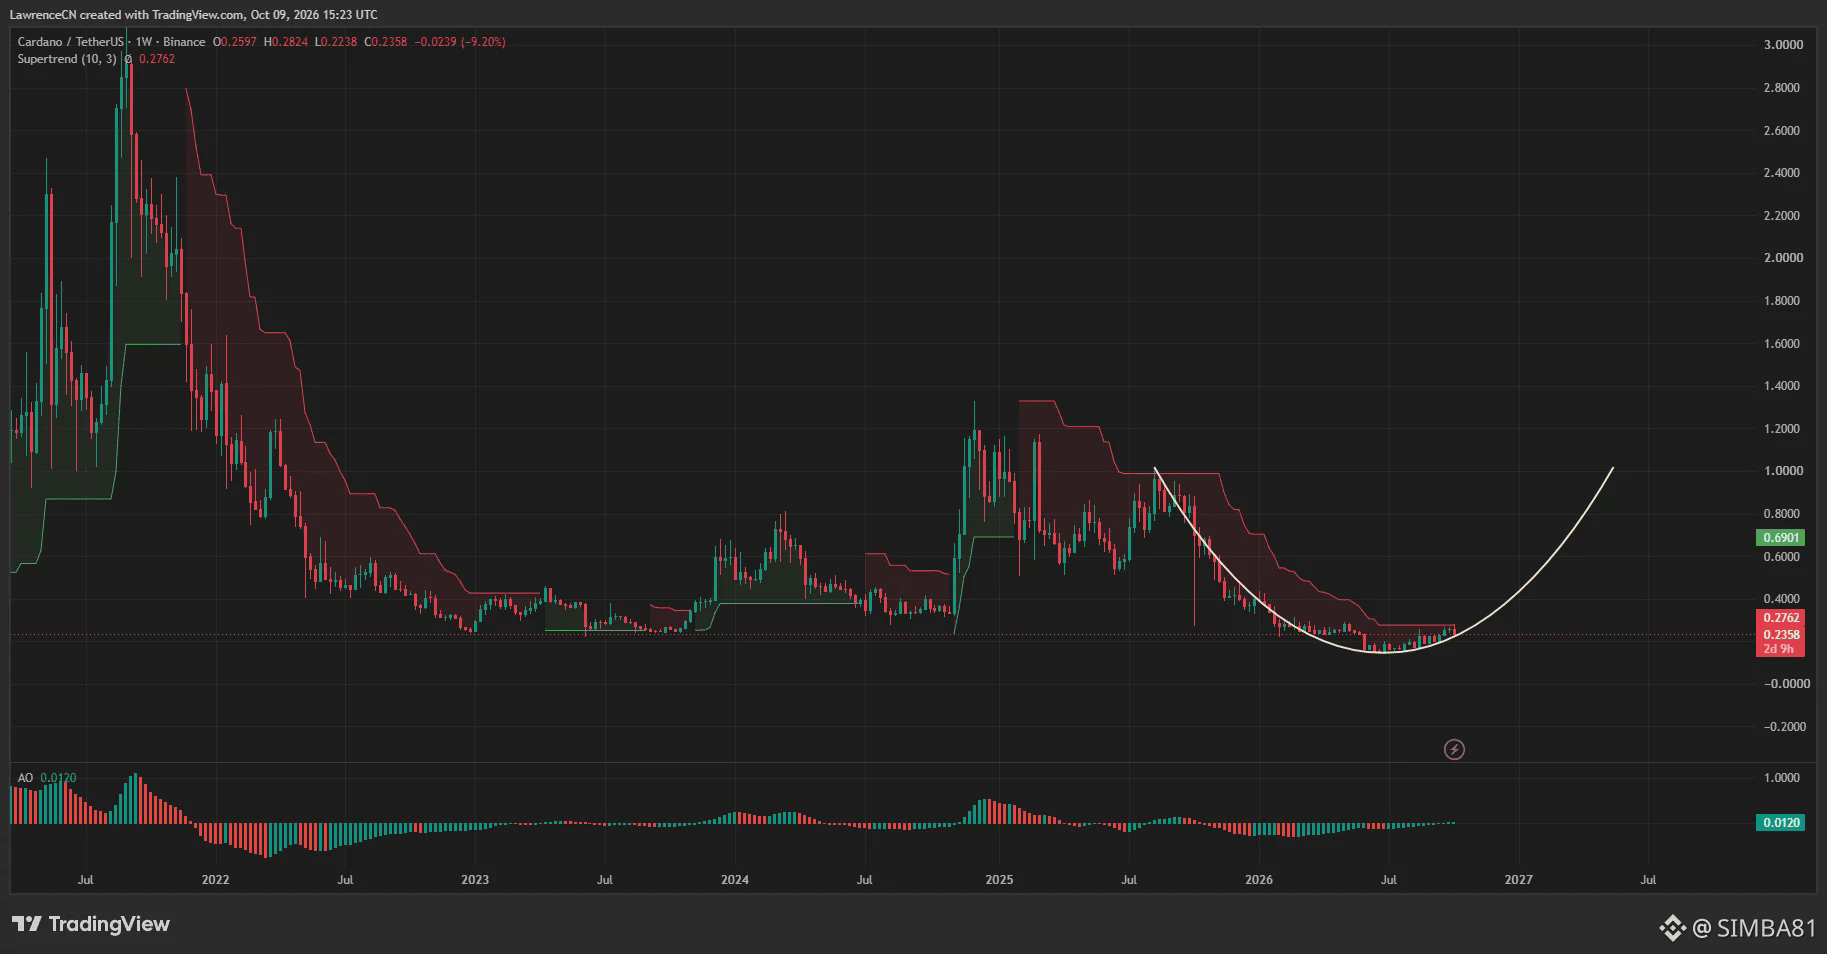
At $0.2358, Cardano would need to rise roughly 17% to reach the Supertrend line. The daily upper Bollinger Band at $0.2700 sits slightly below that weekly reference.
The weekly Awesome Oscillator showed a positive reading of 0.0120, giving a different momentum reading from the daily RSI below 50. The positive oscillator coincided with price remaining beneath the weekly Supertrend.
The longer-term chart showed ADA’s recovery from its midyear low, but the latest weekly decline interrupted that advance. The $0.2700–$0.2824 area now contains the daily upper band, weekly Supertrend and recent weekly high.
Liquidation bands sit above and below ADA’s rebound
CoinGlass’s one-month liquidation heatmap showed visible concentrations around $0.23–$0.24, with further bands below near $0.215–$0.22. Above the latest price, brighter concentrations appeared around $0.257–$0.26 and $0.28.
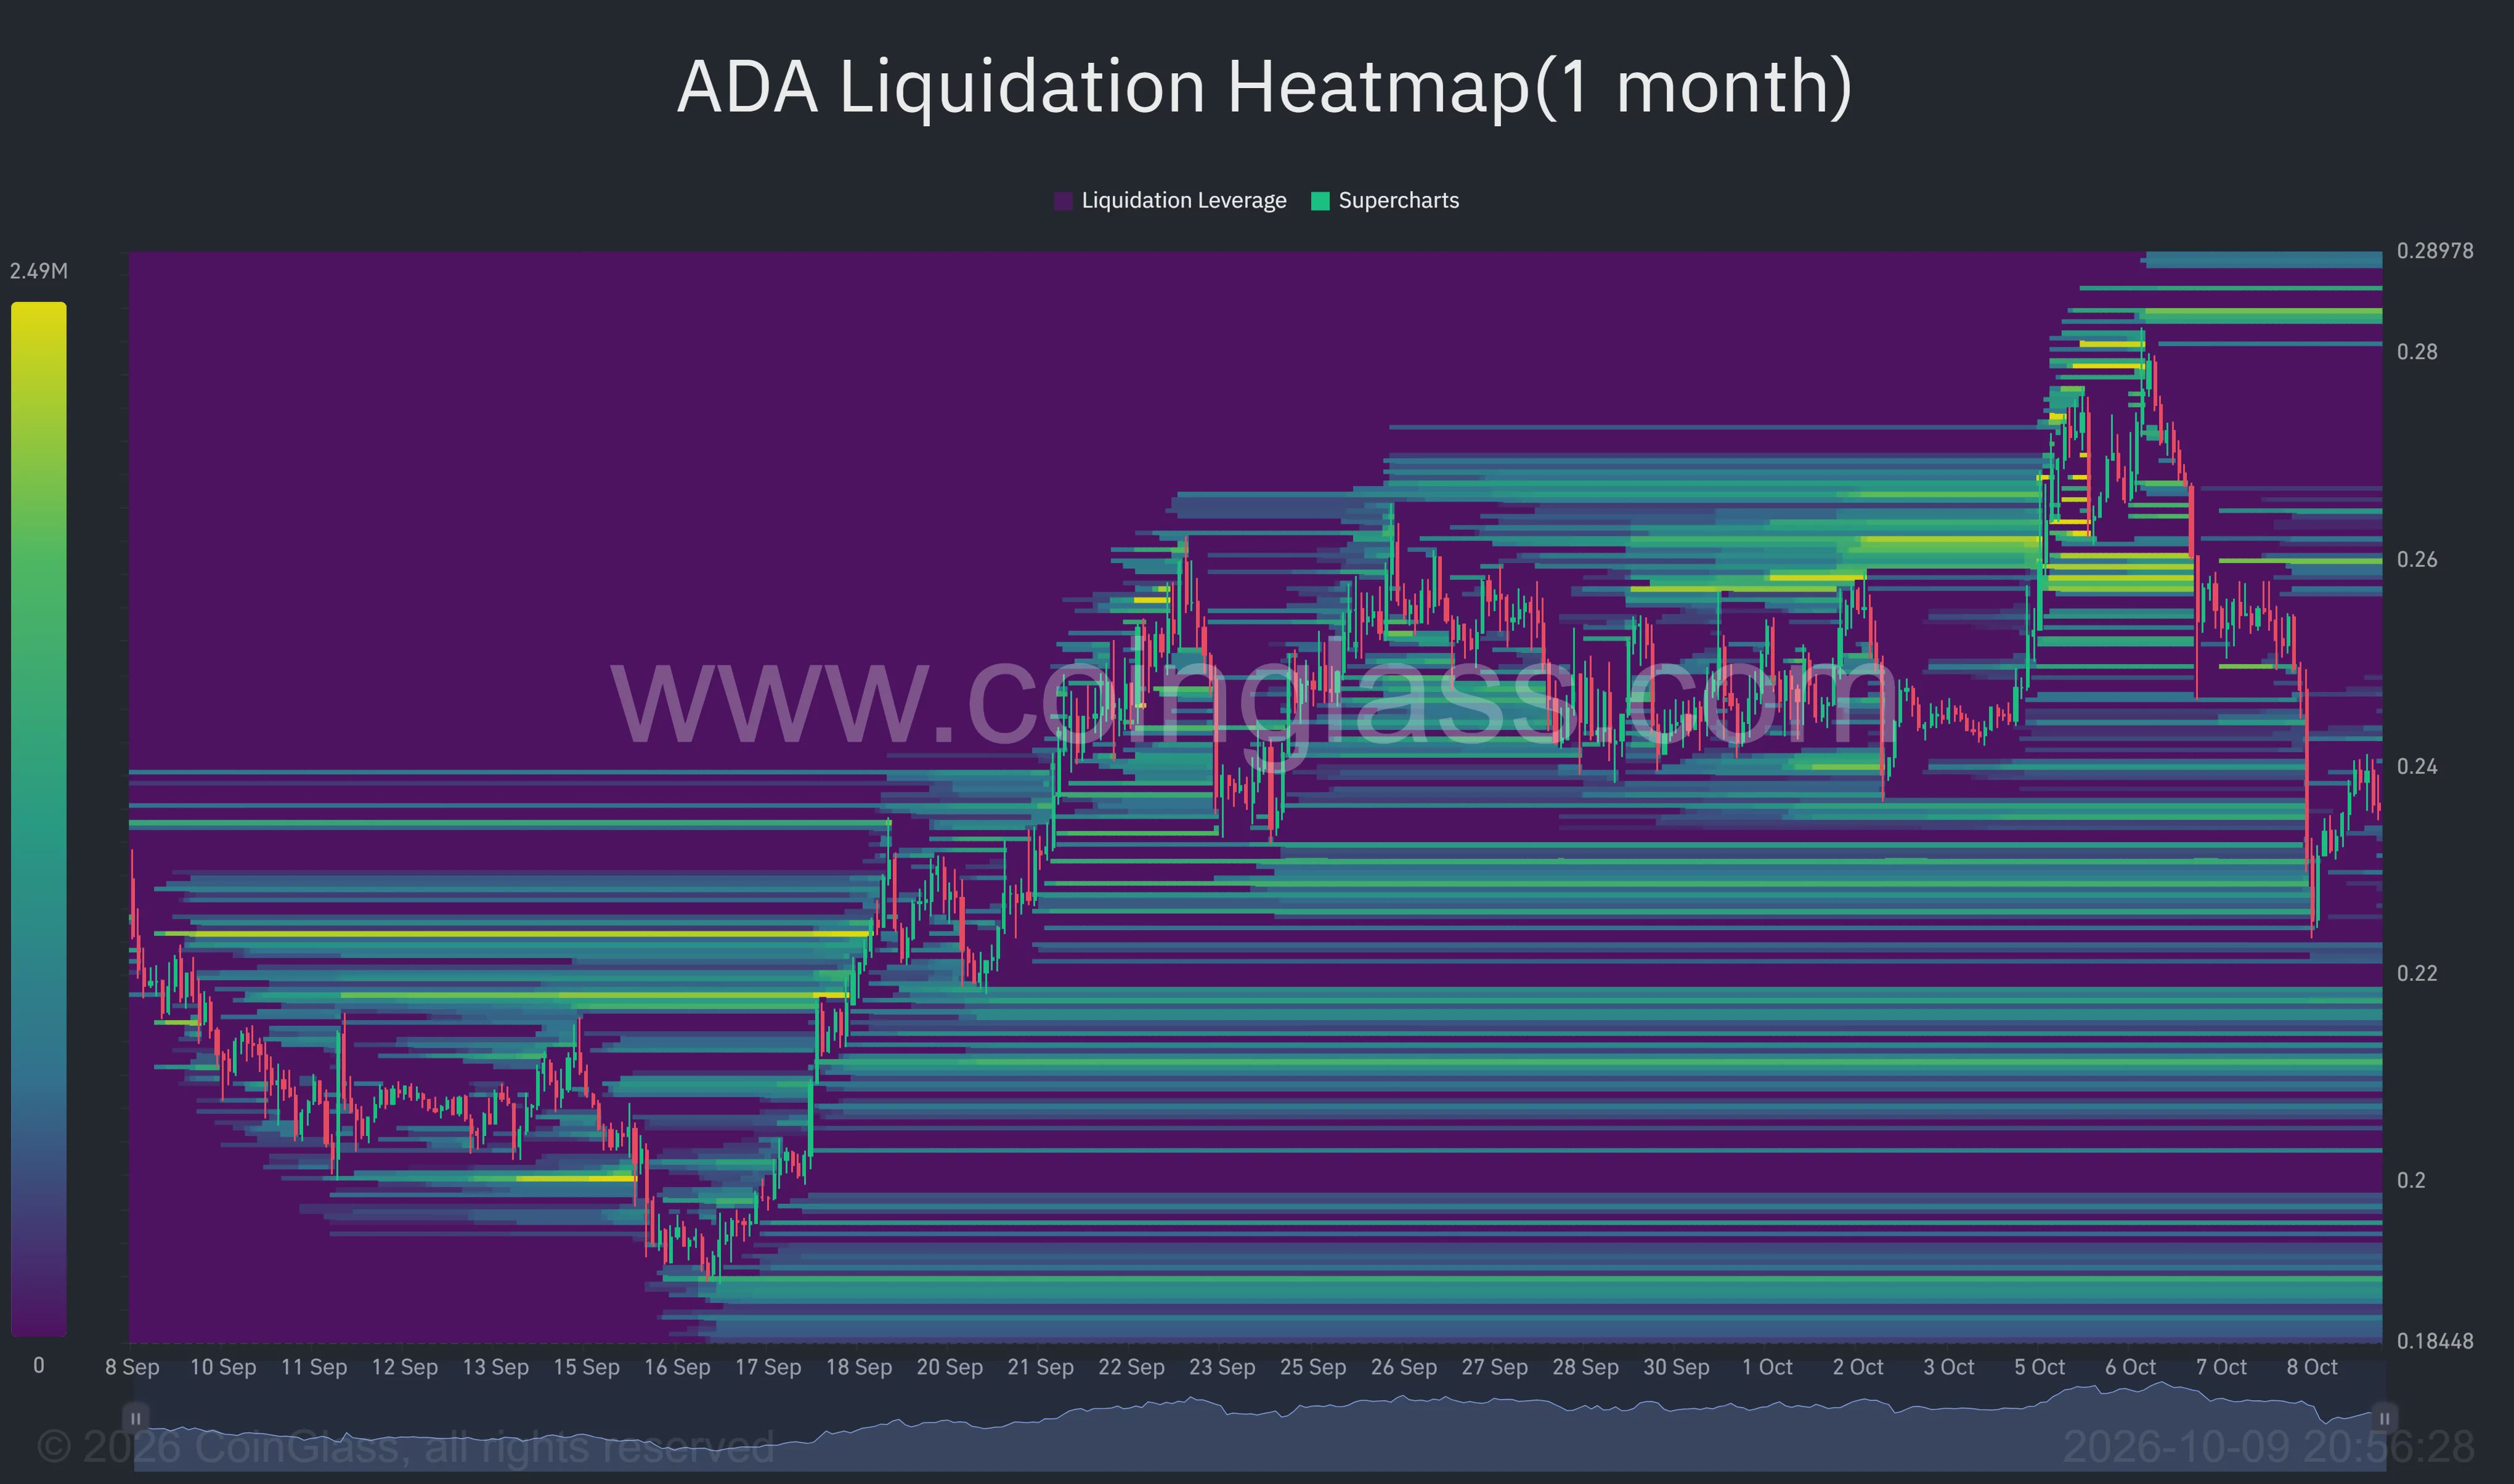
The heatmap traced ADA’s early October rise toward $0.28, followed by its sharp fall toward $0.224 and a partial recovery near $0.24. Its lower concentrations overlap the price region between the recent weekly low and Martinez’s $0.21 channel target.
For US investors using exchange-traded exposure, Volatility Shares’ Cardano ETF provides ADA-linked exposure through instruments rather than directly holding ADA, according to the issuer. Its product disclosures identify price volatility and rebalancing among the fund’s risks.
Cardano’s immediate recovery references remain $0.24 and the $0.2483 daily midpoint. Below the market, $0.2276 and $0.2238 precede the conditional $0.21 downside level identified by Martinez.
Disclosure: This article does not represent investment advice. The content and materials featured on this page are for educational purposes only.
Read more:Ethereum price at $2,500 crossroads as Supertrend turns bearish
Read more about
CardanoPrice Analysis
Follow us on social media
Ethereum price at $2,500 crossroads as Supertrend turns bearish
By Lawrence Mondal
Oct 9, 2026 at 08:14 PM GMT+5
Edited by Lawrence Mondal
Markets
Share
Ethereum price has recovered to around $2,493 after a sharp fall toward $2,400, but its daily Supertrend has turned bearish, and the 4-hour chart still shows negative money flow.
Summary
Ethereum price trades near $2,493 after recovering from its sharp decline toward $2,400.
Daily Supertrend resistance stands at $2,764, above Ethereum’s current price.
The 4-hour Bollinger midpoint at $2,569 marks the next recovery hurdle.
U.S. spot Ethereum ETFs recorded $486.1 million in outflows across four trading sessions.
Ethereum price struggles to recover $2,500
TradingView’s Binance ETH/USDT daily chart showed Ethereum at $2,492.98 on Oct. 9, up 0.73% for the session. The day’s price range extended from $2,471.05 to $2,520.54, leaving ETH below $2,500 despite an earlier move above that level.
The daily chart shows a sharp reversal from the trading range established near $2,650–$2,750 in late September and early October. Ethereum’s latest bounce has recovered only part of that decline, with the price still below the area where it traded before selling accelerated.
On the 4-hour TradingView chart, ETH stood at $2,493.31 after falling 0.53% during the displayed period. Its recovery from the recent low had stalled near $2,500, while the latest candles remained below the chart’s falling moving average.
You might also like:Ethereum’s Glamsterdam upgrade could ease DeFi congestion, Curve says
Analyst Ella identified $2,500 as the first level buyers need to reclaim in an Oct. 9 post. She described Ethereum’s move from approximately $2,700 to a wick near $2,400 as a decline of close to 11%, with selling accelerating toward the end.
Ella said a recovery above $2,500 could ease some of the panic, while failure to regain that level would leave the bounce vulnerable. Her assessment places the immediate focus on whether Ethereum can hold above the round-number threshold after briefly trading through it.
Daily Supertrend turns bearish above ETH
The daily TradingView chart displayed a red Supertrend reading at $2,764.28 following Ethereum’s latest sell-off. The indicator had previously tracked below the price during the advance from August into September.
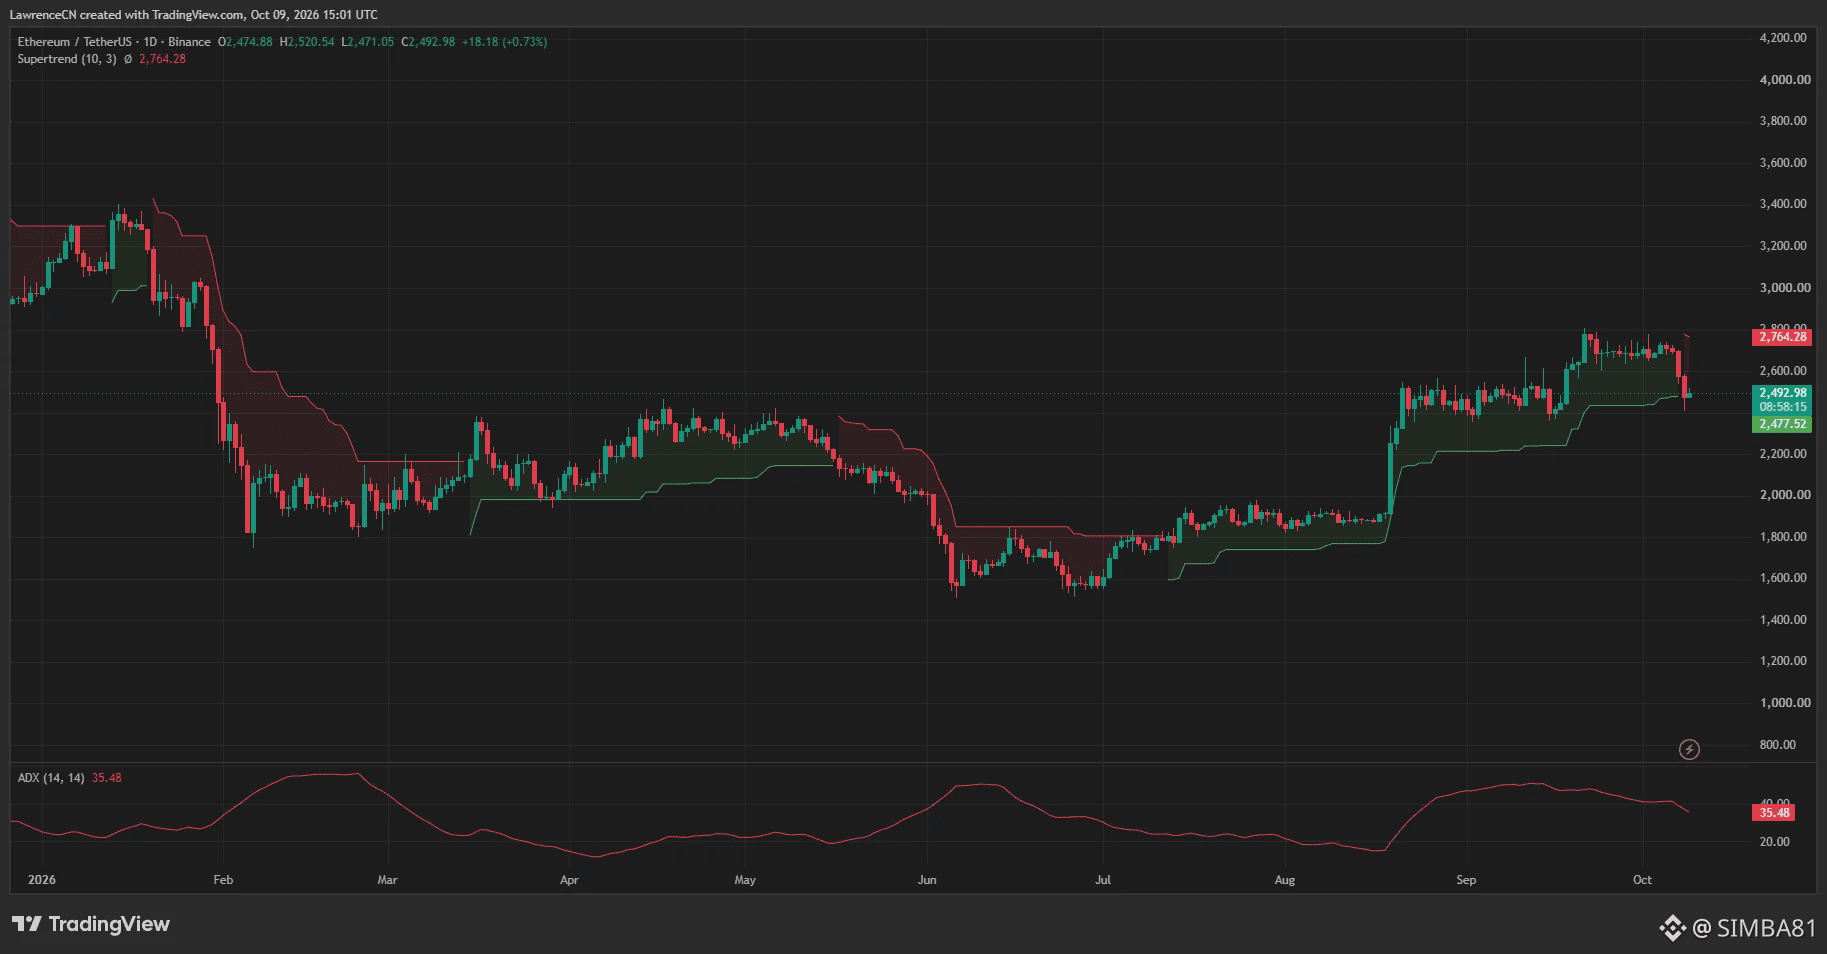
Its shift above ETH places the daily trend signal on the bearish side. At approximately $2,493, Ethereum traded nearly 10% below the Supertrend level, leaving a substantial gap between the rebound and a potential reversal of that signal.
The earlier green Supertrend line ended around $2,477.52, close to the current price. Ethereum’s sharp downward wick passed below that area before the rebound, while the newly displayed red line established a higher resistance threshold.
TradingView’s daily Average Directional Index stood at 35.48. The reading remained above 25, a commonly used threshold for an established trend, although the line had declined from its September highs.
ADX measures trend strength rather than direction. In Ethereum’s current setup, the bearish direction comes from the Supertrend change and the price breakdown, while the falling ADX shows that measured trend strength has eased from earlier readings.
The daily chart also places the former $2,650–$2,750 trading range above the market. A recovery into that area would retrace more of the recent fall, but ETH would still need to clear the Supertrend resistance near $2,764 to reverse the indicator’s bearish setting.
The 4-hour chart puts $2,569 ahead of a stronger recovery
Ethereum’s 4-hour Bollinger Bands showed a midpoint of $2,568.56, an upper band of $2,731.37 and a lower band of $2,405.75. ETH traded in the lower half of that range after bouncing from near the lower boundary.
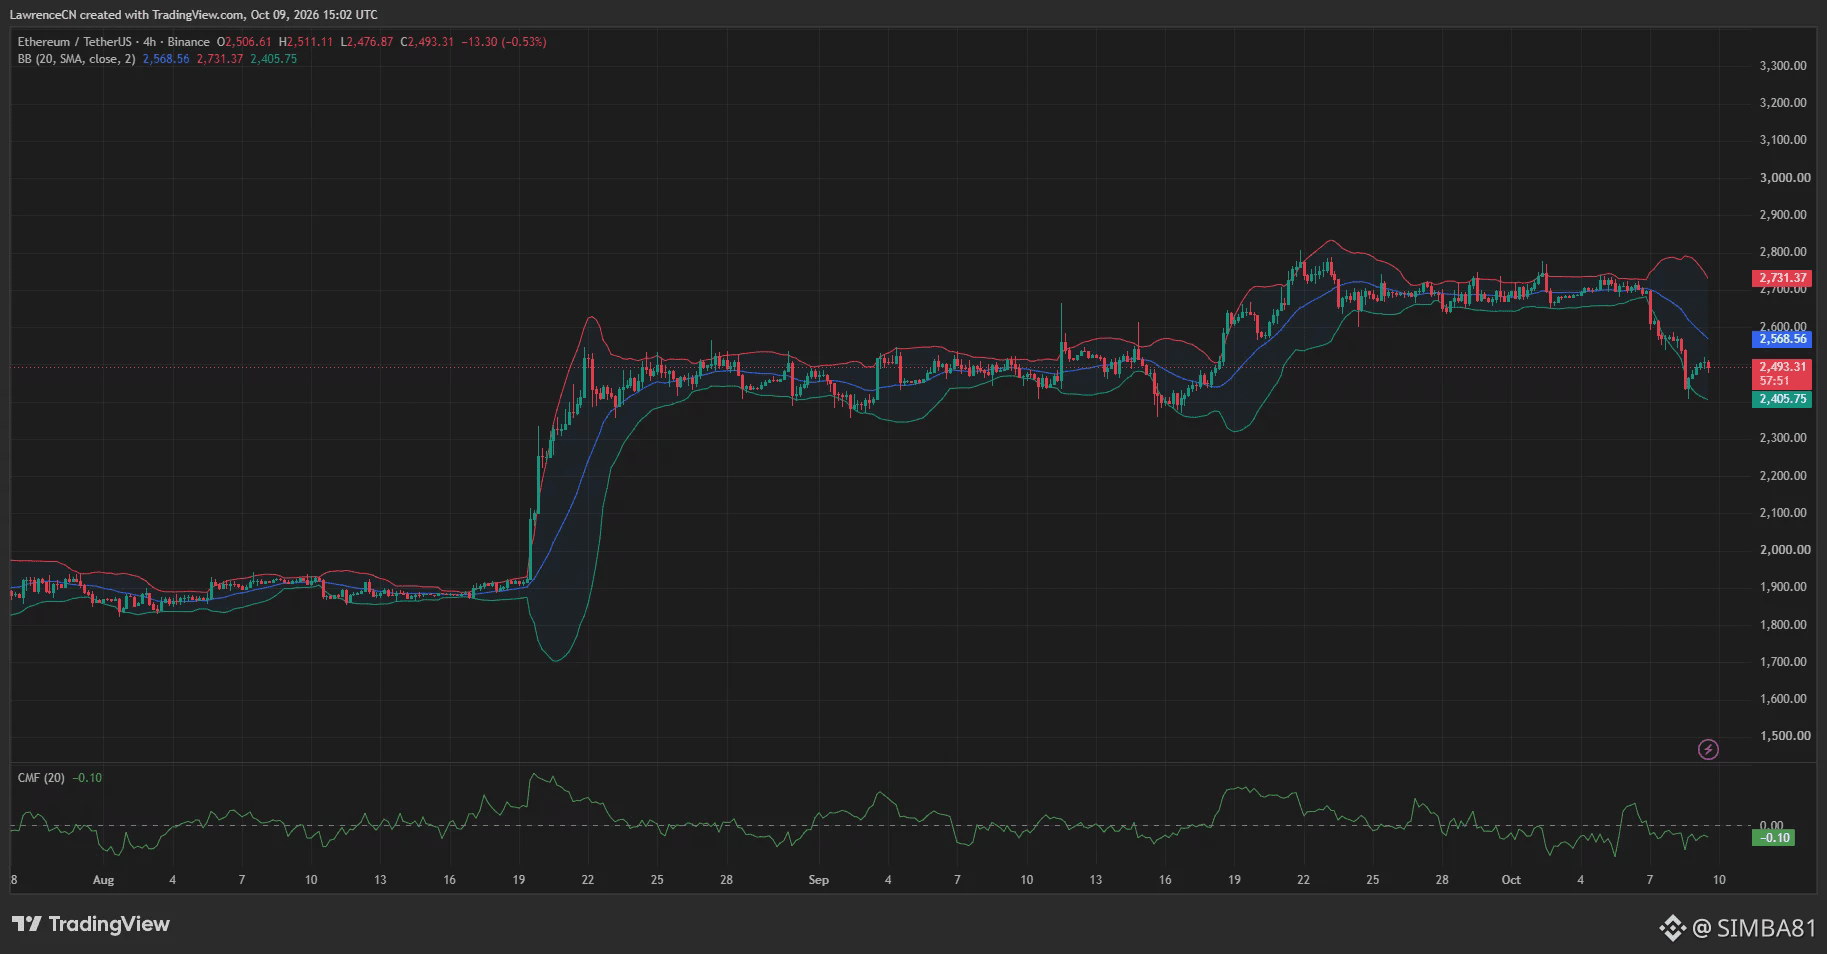
The midpoint stood roughly 3% above the displayed price. A move above $2,500 would therefore clear the nearest round-number hurdle while leaving the 20-period moving average around $2,569 as the next technical test.
The bands had widened during the sell-off, with the upper boundary rising and the lower boundary falling. On the chart, that expansion accompanied the break from Ethereum’s earlier consolidation around $2,700.
The 4-hour Chaikin Money Flow reading was negative at -0.10. The indicator’s position below zero points to selling pressure across its measurement period, even after Ethereum recovered from the low.
Together, the price below the Bollinger midpoint and negative CMF leave the short-term recovery without a clear bullish confirmation. A sustained move above $2,569 alongside CMF returning above zero would strengthen the recovery case on that timeframe.
On the downside, the lower Bollinger Band near $2,406 overlaps with the recent price trough around $2,400. A break below that zone would take Ethereum beneath both the latest low area and the displayed band boundary.
ETF withdrawals continue as liquidation clusters sit overhead
Farside Investors recorded $201.9 million in U.S. spot Ethereum ETF outflows on Oct. 6 and another $160.9 million on Oct. 7. Combined withdrawals reached $362.8 million across those two sessions.
The same dataset showed $72.5 million in further outflows on Oct. 8. Including the $50.8 million withdrawn on Oct. 5, net redemptions totaled $486.1 million across four trading sessions, extending the funds’ outflow streak to eight sessions.
CoinGlass’s one-week Ethereum liquidation heatmap showed its brightest remaining overhead concentration around $2,635–$2,640. Additional bands appeared near $2,610 and across approximately $2,740–$2,760, above the current market price.
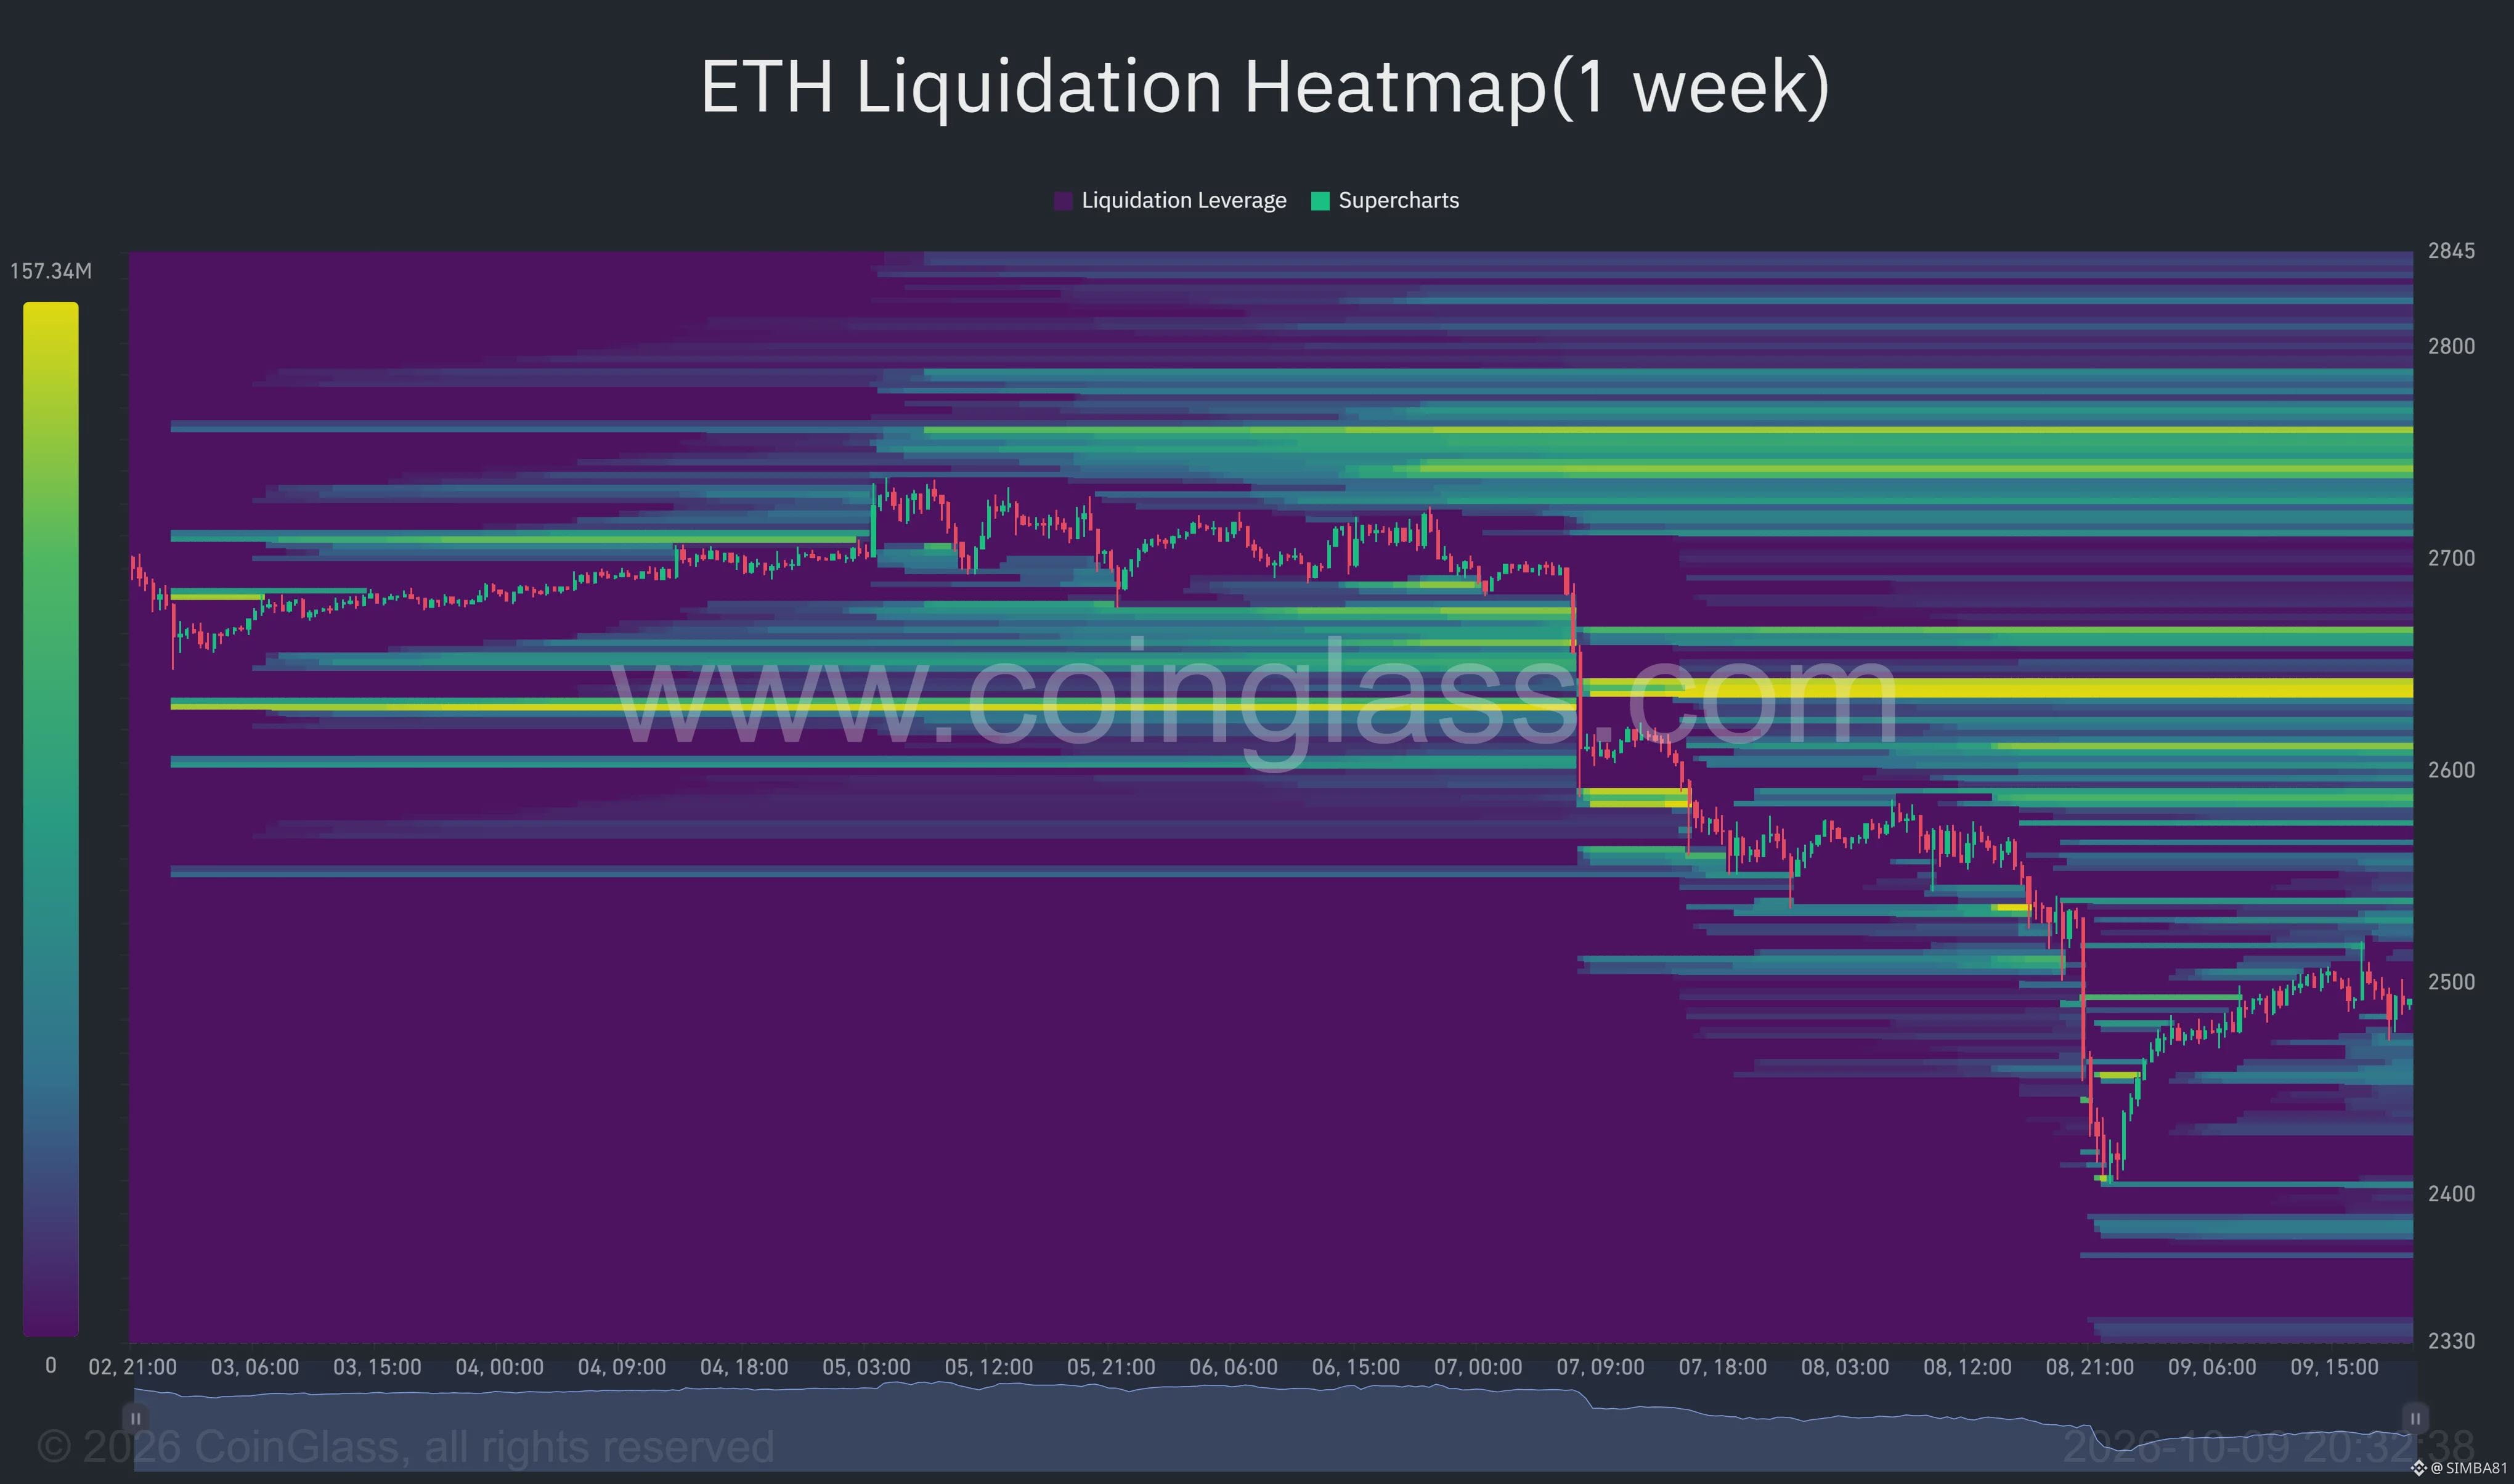
Below ETH, the heatmap displayed smaller concentrations around $2,450–$2,460 and $2,400, with further bands near $2,380. Those levels sit beneath the rebound and around the area reached during the sharpest part of the decline.
A separate weekly assessment from the analyst publishing as Wealthmanager offered a longer-term bullish scenario. The analyst described an inverse head-and-shoulders setup, a reclaimed neckline and improving RSI, with a successful retest potentially opening a move toward $3,200–$4,000.
That forecast remains conditional on the weekly retest holding. On the shorter TradingView timeframes, Ethereum still faces $2,500 and $2,569 before the former trading range and daily Supertrend resistance near $2,764.