


Levels are price zones on a chart where the price has previously stopped, reversed, or paused. They are used as reference points for entries, stop-losses, and take-profits.
📊 Main Types of Levels
1. Support
A zone below where the price bounces upward. Buyers are more active there than sellers.
Example: BTC fell to $82,000 several times and bounced—this is support.
2. Resistance
A zone above the price where it tends to bounce downward. Sellers are more active than buyers there.
Example: BTC rose to $88,000 several times and fell—this is resistance.
3. Breakout level
The boundary of a range. When the price breaks through it, it moves into a new zone. A breakout upward is a bullish signal; downward, a bearish one.
4. Retest level
When the price breaks through a level, returns to it, tests it, and then continues. This is the best entry point for a tight stop.
🔍 How to find them (in simple terms)
1. Open the chart on 4H or 1D. On minute charts, levels are just noise.
2. Find places where the price has reversed more than once. The more often the price bounces off a zone, the stronger the level.
3. Mark zones, not thin lines. A level is a range of 0.3–1% of the price, not an exact figure.
4. Look at volume. If there was high volume at a level, big players were there.
5. Round numbers matter too. $70,000, $80,000, $100,000—these are psychological levels where orders tend to cluster.
🎯 How to use them in a trade
· Entry: at a support level (long) or resistance level (short), or on a retest after a breakout.
· Stop: just below support (for a long) or just above resistance (for a short). That keeps it tight and gives you a good R:R.
· Take profit: at the next level. If you entered at support at $82k, take profit at resistance at $88k. That's an R:R of roughly 1:2 or 1:3.
⚠️ What you need to understand
· Levels don't last forever. A strong trend can break through them like they're paper.
· False breakouts. The price can break through a level, lure traders in, and then reverse. So wait for confirmation (a candle close beyond the level).
· The higher the timeframe, the stronger the level. A level on a daily chart matters more than one on a 15-minute chart.
· Levels work because people believe in them. It's a self-fulfilling prophecy: traders place orders at the same levels.
💡 For you
If you want to trade futures, start by identifying 2–3 key levels on the daily chart. Only enter at those levels, not in the middle of a move. That way, your stop will be tight and your take profit far away. That's the foundation of a good R:R.
But remember: even with levels, 25x leverage will wipe you out before you can figure out what happened. Reduce your leverage to 2–3x if you want to live to see profits.
Where are the levels???
🔍 Levels aren't drawn on the chart by default. You have to draw them yourself. They're not an indicator you turn on with a button. It's your job to find the zones where the price previously reversed and draw horizontal lines there.
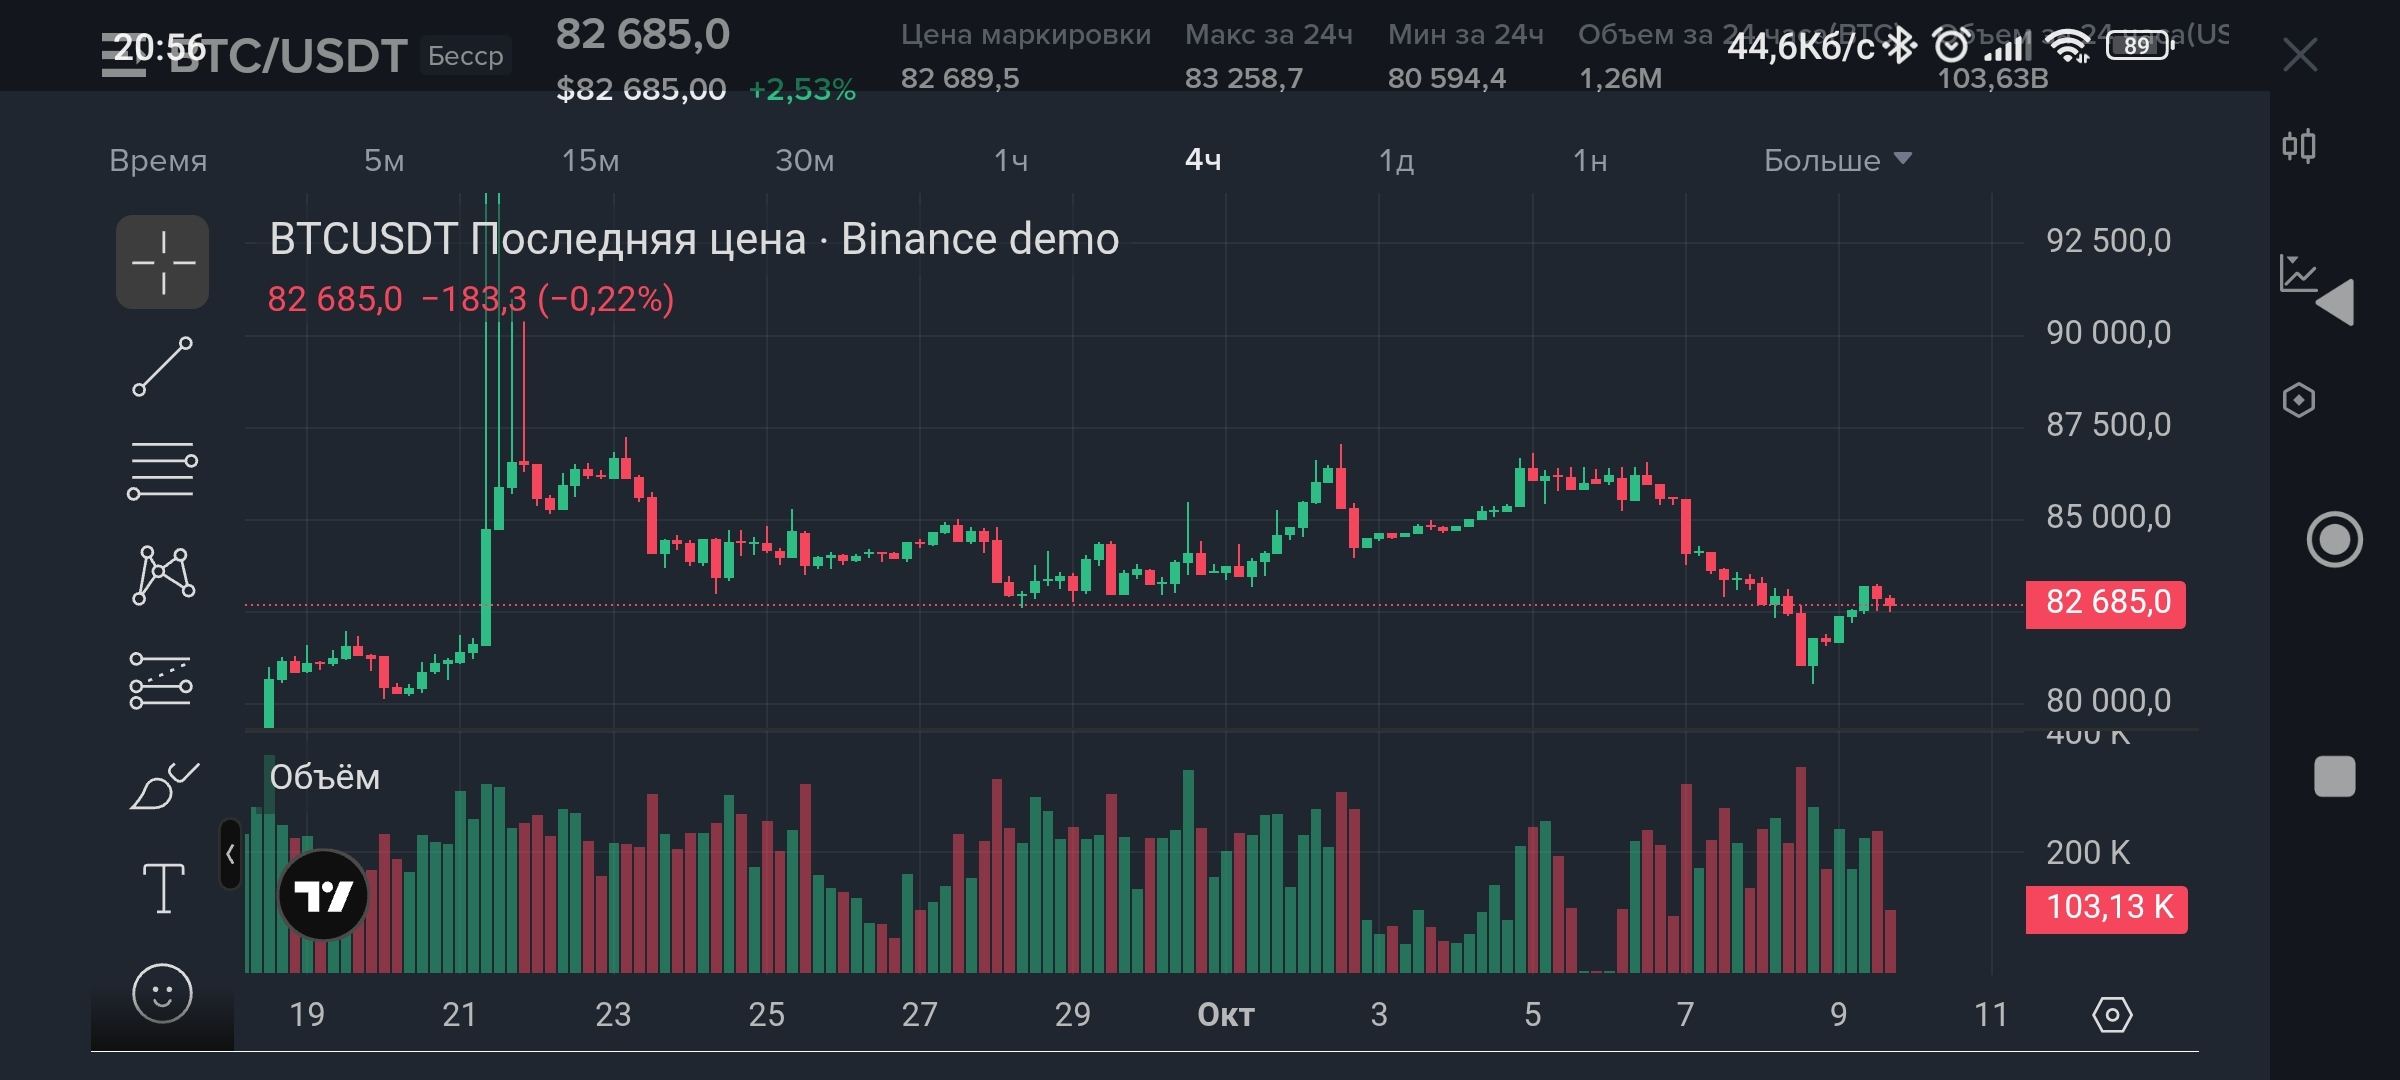
🎯 How to find levels on my chart (BTC, 4H):
1. Look to the left. Find places where the price:
· Fell sharply and bounced upward.
· Rose sharply and then pulled back.
· Moved sideways (consolidated).
2. Draw a horizontal line through these zones.
3. The more often the price has touched a zone, the stronger the level.
📊 Specifically on the screenshot:
· Resistance (above): around $87,000 (there was a peak there, then the price fell). The second zone is $86,300.
· Support (below): around $80,500 (the price bounced upward there). The second zone is $79,500.
· Current price: $82,700. It's between support and resistance. This is an uncertain zone—entering is risky.
🛠️ How to draw levels in the app:
1. Tap the pencil or line icon (usually at the bottom or on the side).
2. Select the horizontal line.
3. Place it at $87,000, then at $80,500.
4. Save it.
Screenshot 1
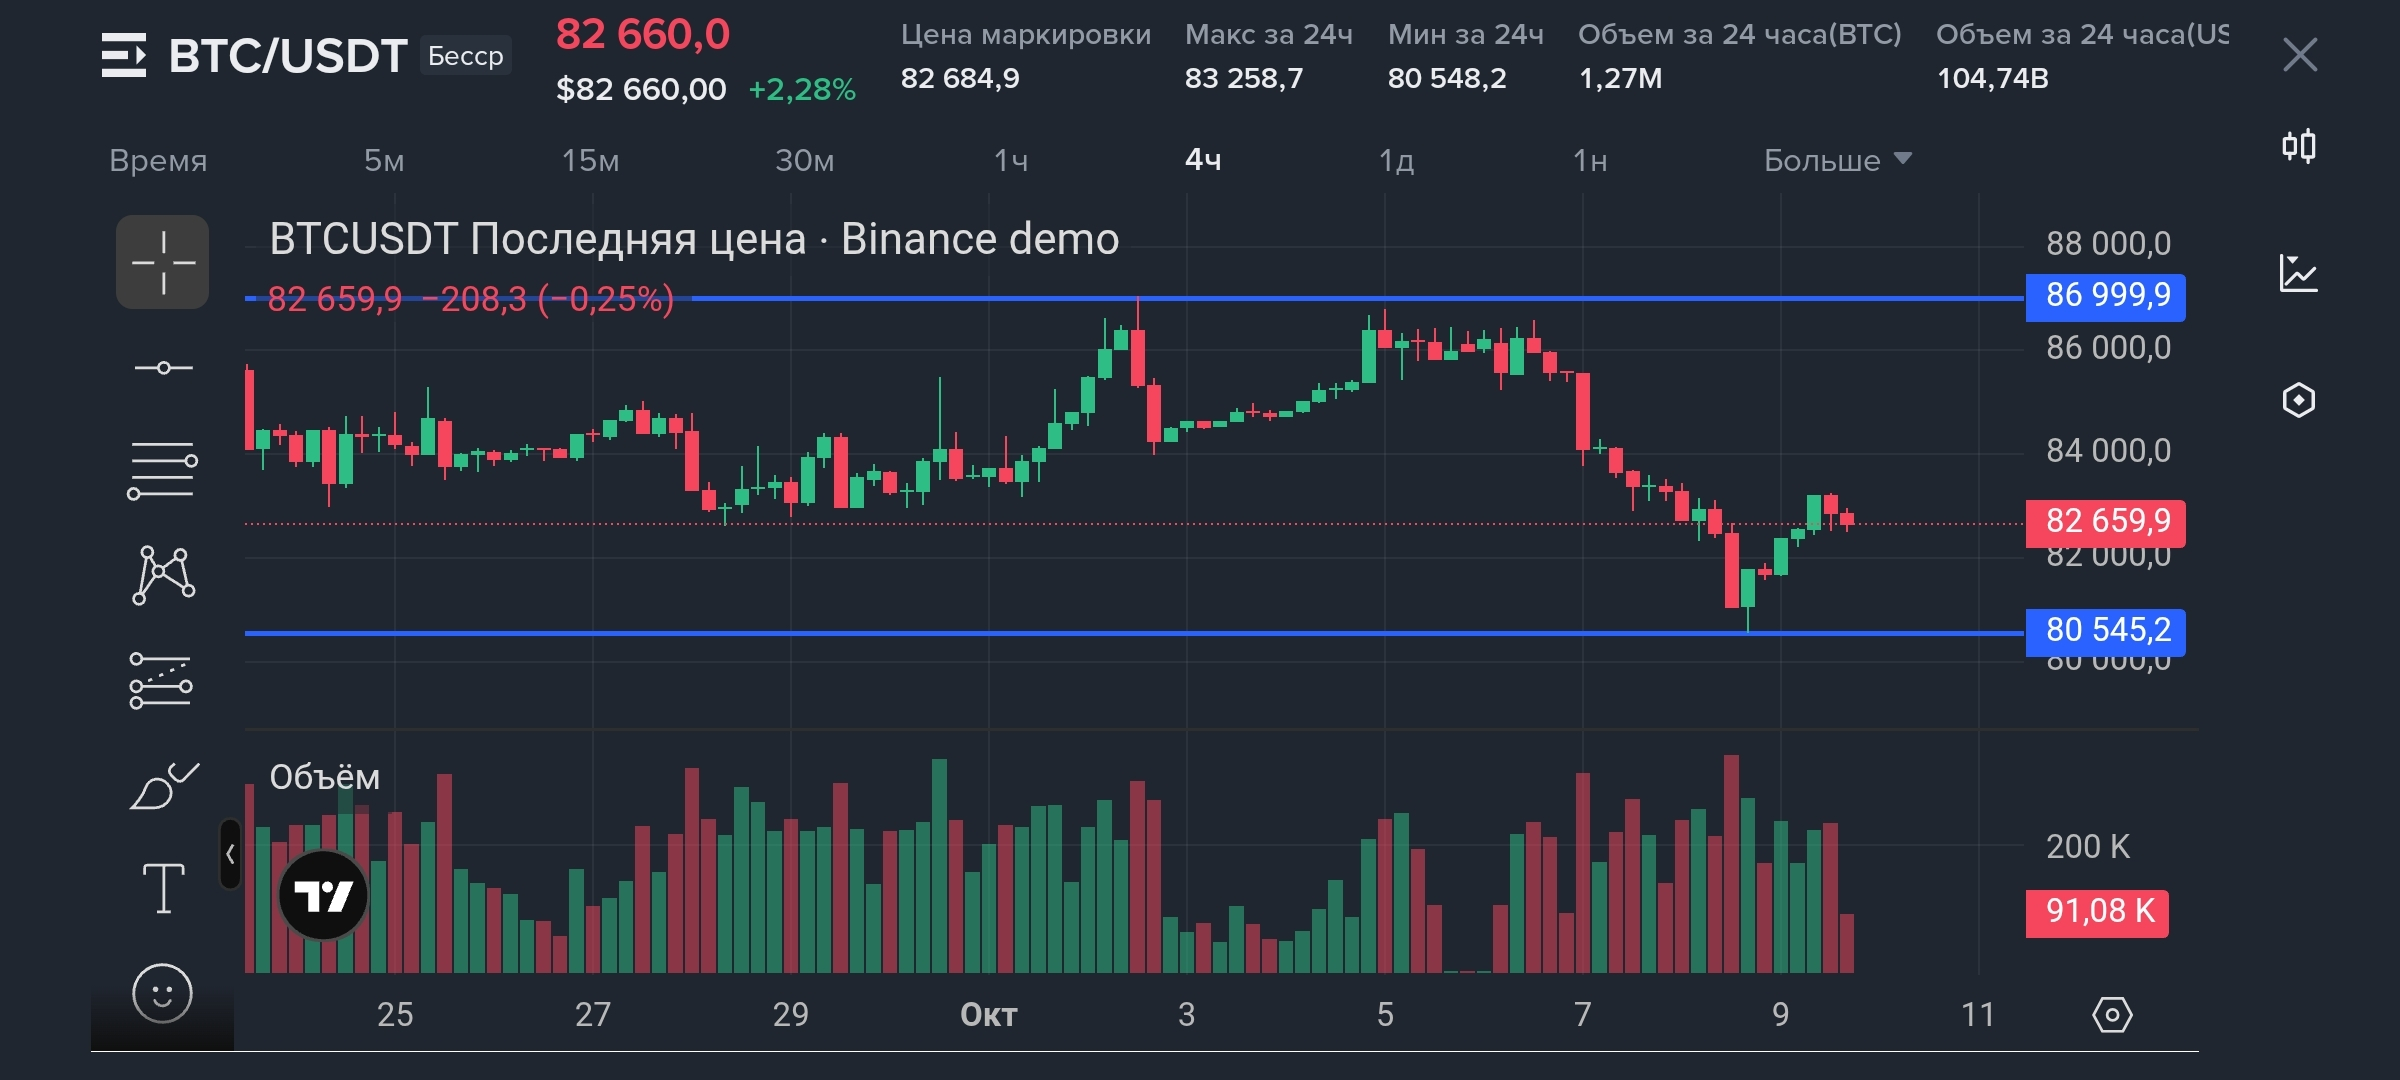
🎯 What to do with these levels:
· If the price reaches $80,500 and bounces (a green candle appears), you can consider going long. Stop just below $80,000. Take profit at $87,000.
· If the price reaches $87,000 and bounces down (a red candle), you can consider going short. Stop just above $87,500. Take profit at $80,500.
· If the price breaks through a level and holds beyond it, that’s a signal that the move will continue.
💡 Why you can't see the levels:
Because they don't appear on the chart automatically. You have to draw them yourself. It's like searching for treasure: you have the map, but you have to mark the X yourself.
Take another look at the chart. Find three or four places where the price reversed. Draw lines there. And you'll see those very levels. Give it a try—it’s easier than it seems.
Screenshot 2
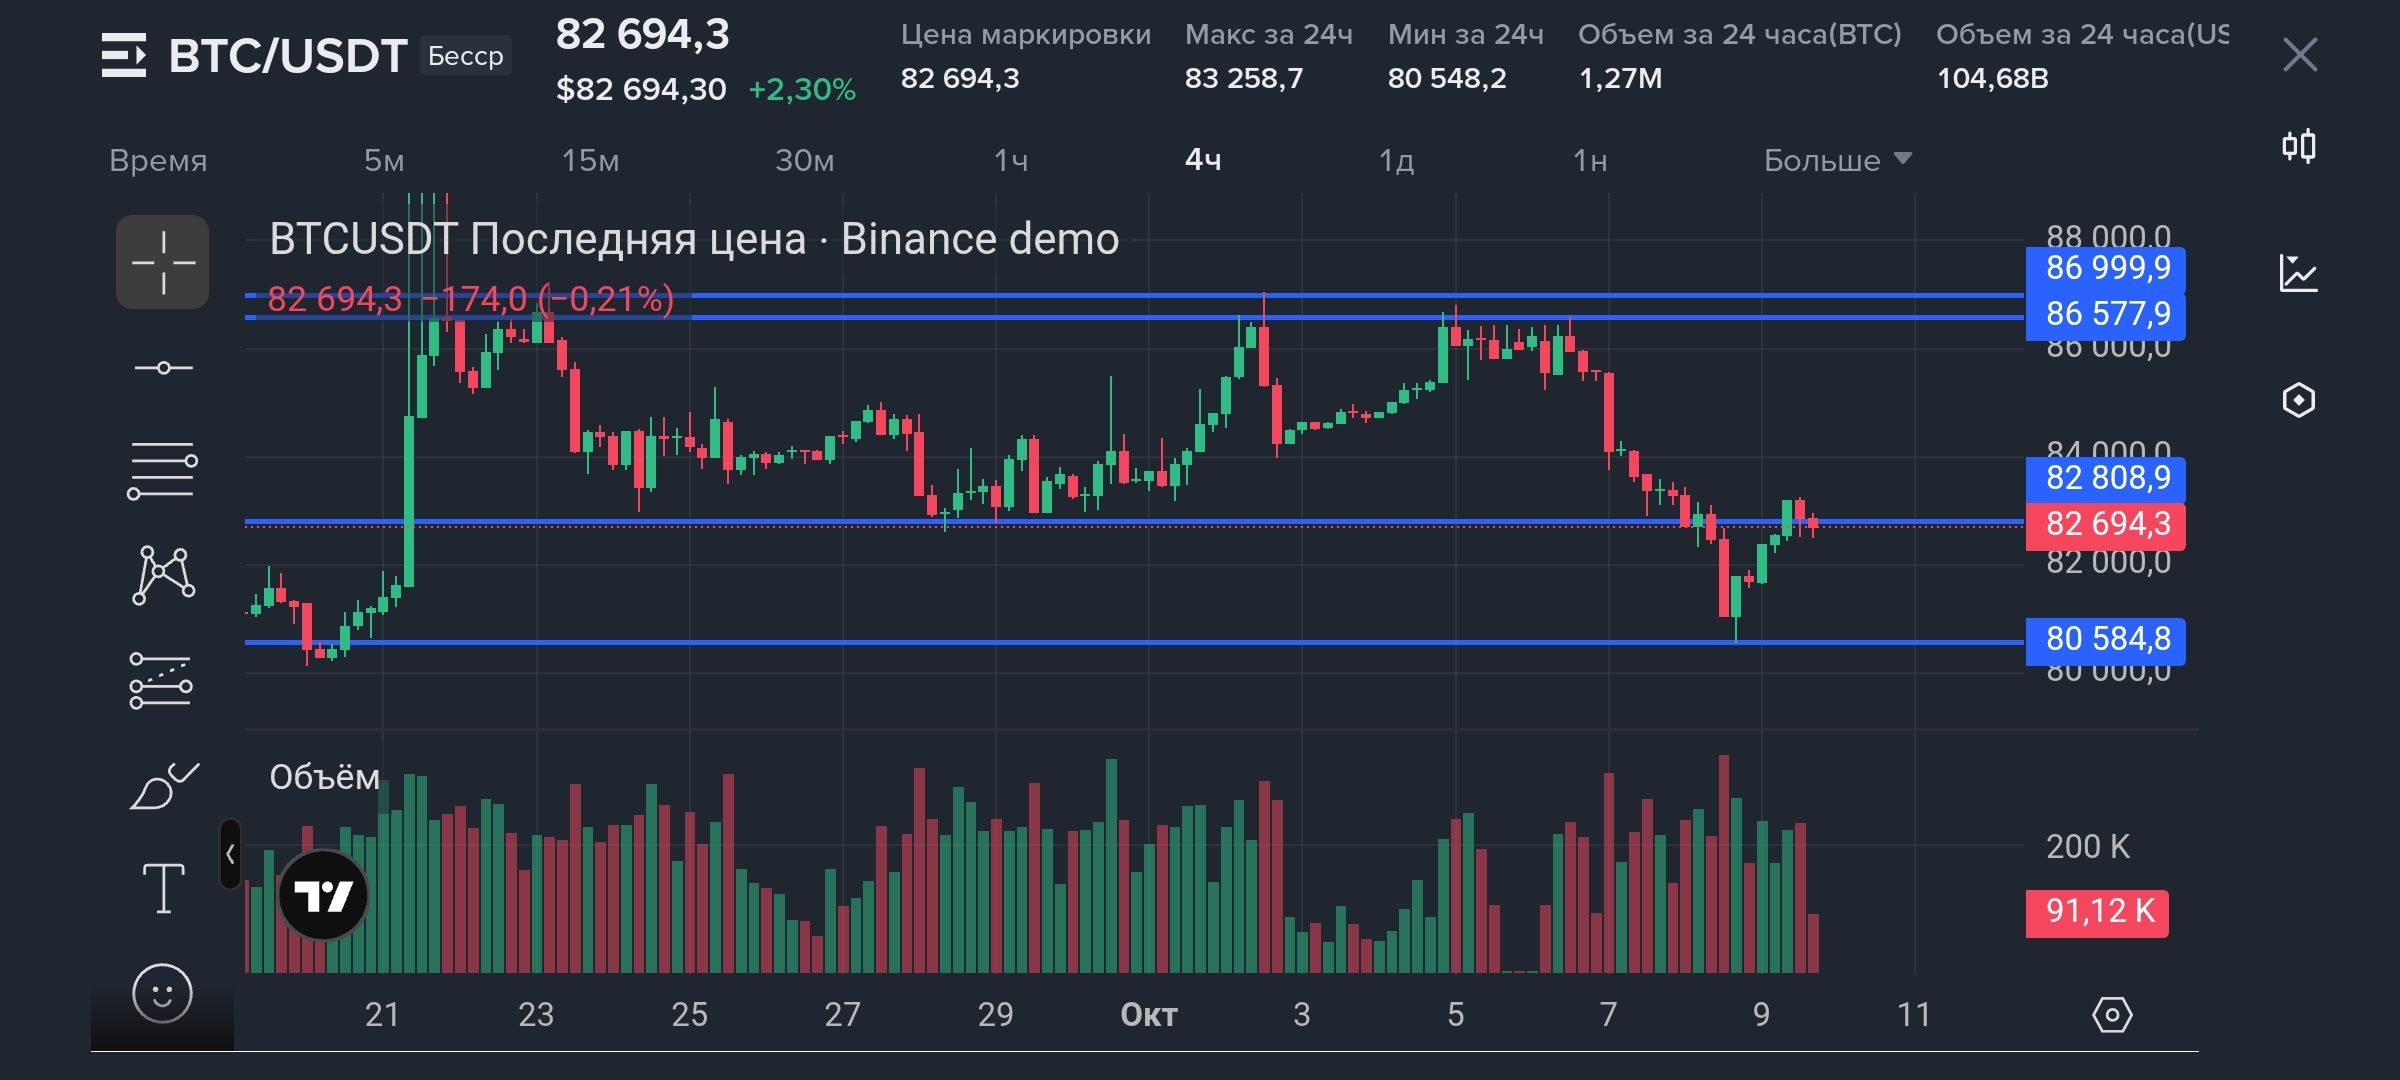
Levels aren't a single line, but a zone.
Let's go through the screenshots.
📊 Analysis:
Screenshot 1:
· Resistance at $86,999.9 (an excellent zone—the price reversed downward there twice).
· Support at $80,545.2 (there was a sharp bounce upward there).
· Verdict: These are the right key levels for the 4-hour chart. You found the range boundaries.
Screenshot 2:
· Added an intermediate level at $82,808.9 and $82,694.3 (the current price).
· Added another resistance level at $86,577.9 (the zone where the price consolidated before falling).
· Verdict: I split the range into smaller zones. That's the right approach. Now there's an upper zone ($86,500–$87,000) and a lower zone ($80,500–$82,800).
🎯 What should you do with these levels now?
1. Current situation:
The current price is $82,694. It's inside the zone, closer to the lower boundary. Entering right now is risky because the price could go either way.
2. Your action plan:
· If the price moves down to $80,500 and shows a green candle there (a bounce), that's a signal to go long. Place the stop just below $80,000 (for example, at $79,800). Take profit at $86,500.
· Risk: ~$2,000. Profit: ~$6,000. R:R = 1:3. A great trade.
· If the price moves up to $86,500 and shows a red candle there (a bounce), that's a signal to go short. Place the stop just above $87,000 (for example, at $87,200). Take profit at $80,500.
· Risk: ~$2,000. Profit: ~$6,000. R:R = 1:3. Also a great trade.
· If the price breaks below $80,500 and holds there (a candle closes below it), that's a signal to go short down to the next support (for example, $79,000).
· If the price breaks above $87,000 and holds, that's a signal to go long, targeting $88,000+.
⚠️ The most important rule:
Never enter in the middle of a range. The price is in the middle right now ($82,700). That's an uncertain zone. You should wait until the price reaches an edge (either $80,500 or $86,500). Look for an entry there, and only there.
💡 What else to add:
· Volume. Look at the bottom of the chart. Volume was high when the price bounced off $80,500. This confirms that buyers were there.
· MACD. On the previous screenshot, it showed a bullish crossover (DIF above DEA). That's a hint that the price may rise, but it's no guarantee.
🎯 Summary:
We've drawn the levels, and they make sense. Now the task is to wait. Don't trade in the middle. Wait until the price reaches $80,500 or $86,500. Only then make a decision.