

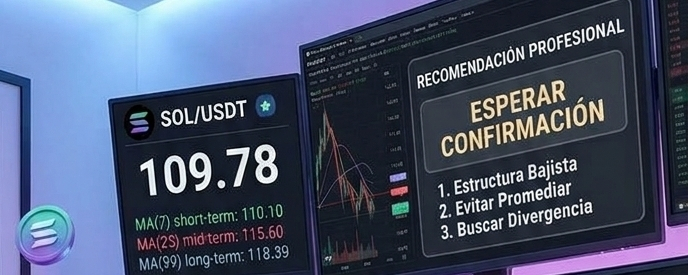

of SOL/USDT on the 4-hour timeframe (4
J
1. Contextual Analysis and Market Structure
Dominant Trend: Clearly bearish in the short/medium term. The price suffered a steep drop from the $121.68–$124.95 zone, reaching a low of $105.71.
Moving Average (MA) Alignment:
MA(7) = $110.10 (Yellow)
MA(25) = $115.60 (Purple)
MA(99) = $118.39 (Dark purple) The moving averages are arranged in a bearish fan (MA(7)
2. Key Support and Resistance Levels
Average Purchase Price (Your position): $112.73. The position is currently at an unrealized loss of approximately −2.6%.
Immediate Support: $105.71 (recent 24-hour low and technical rebound point).
Immediate Resistance: $110.10–$110.50 (intersection with the MA(7)).
Major Resistance / Key Zone: $113.20–$115.60 (coincides with your entry price and the MA(25)).
3. Price Action and Volume
High Sell Volume: Selling volume (red bars) increased substantially when support at 113.00 broke, indicating capitulation by short-term buyers and liquidations.
Current Rebound: After touching 105.71, a weak rebound formed toward 109.78. After a vertical drop, this type of move is usually a technical oversold bounce (a temporary "dead cat bounce") to test previous resistance levels, rather than a confirmed trend reversal.
4. Is it advisable to enter (buy) at this time?
Professional Verdict: This is NOT an ideal time to open new long positions or aggressively average down.
Reasons:
No Reversal Structure: There is no validated trend-reversal pattern (such as a confirmed double bottom or a significant bullish engulfing candle with declining volume during the correction).
Immediate Overhead Resistance: The price is approaching the MA(7) at 110.10, which will act as the first selling barrier.
Risk of Further Downside: On 4-hour charts, sellers remain in control. Entering here is like trying to "catch a falling knife."
5. Trading Scenarios and Action Plan
If you were considering placing a trade or managing your current position:
Scenario A (Managing an Existing Position Entered at 112.73):
If the price manages to rebound toward the $111.80–$112.70 area, consider reducing your exposure or exiting at breakeven to protect your capital. The MA(25) at 115.60 will act as very strong resistance and will be difficult to break without a strong catalyst.
Scenario B (Conservative Buy Entry / Re-entry):
Option 1 (Wait for confirmation of a bottom): Let the price return to test the $105.00–$105.71 area. If it consolidates there, forming a double bottom with bullish divergence on the RSI, only then could you look for a carefully sized entry, with a Stop Loss below 104.50.
Option 2 (Wait for the structure to recover): Wait for the price to break above the $113.50 area on volume and consolidate above the MA(25) before entering.
Note: The information presented is educational technical analysis and does not constitute formal financial advice. Always define your risk management strategy and Stop Loss limits before placing any order.