
🚨 Bitcoin BTCUSDT Analysis | 4-Hour Timeframe (4H)
📊 Has Bitcoin started a new upward wave, or are we seeing a temporary bounce before the downtrend continues?
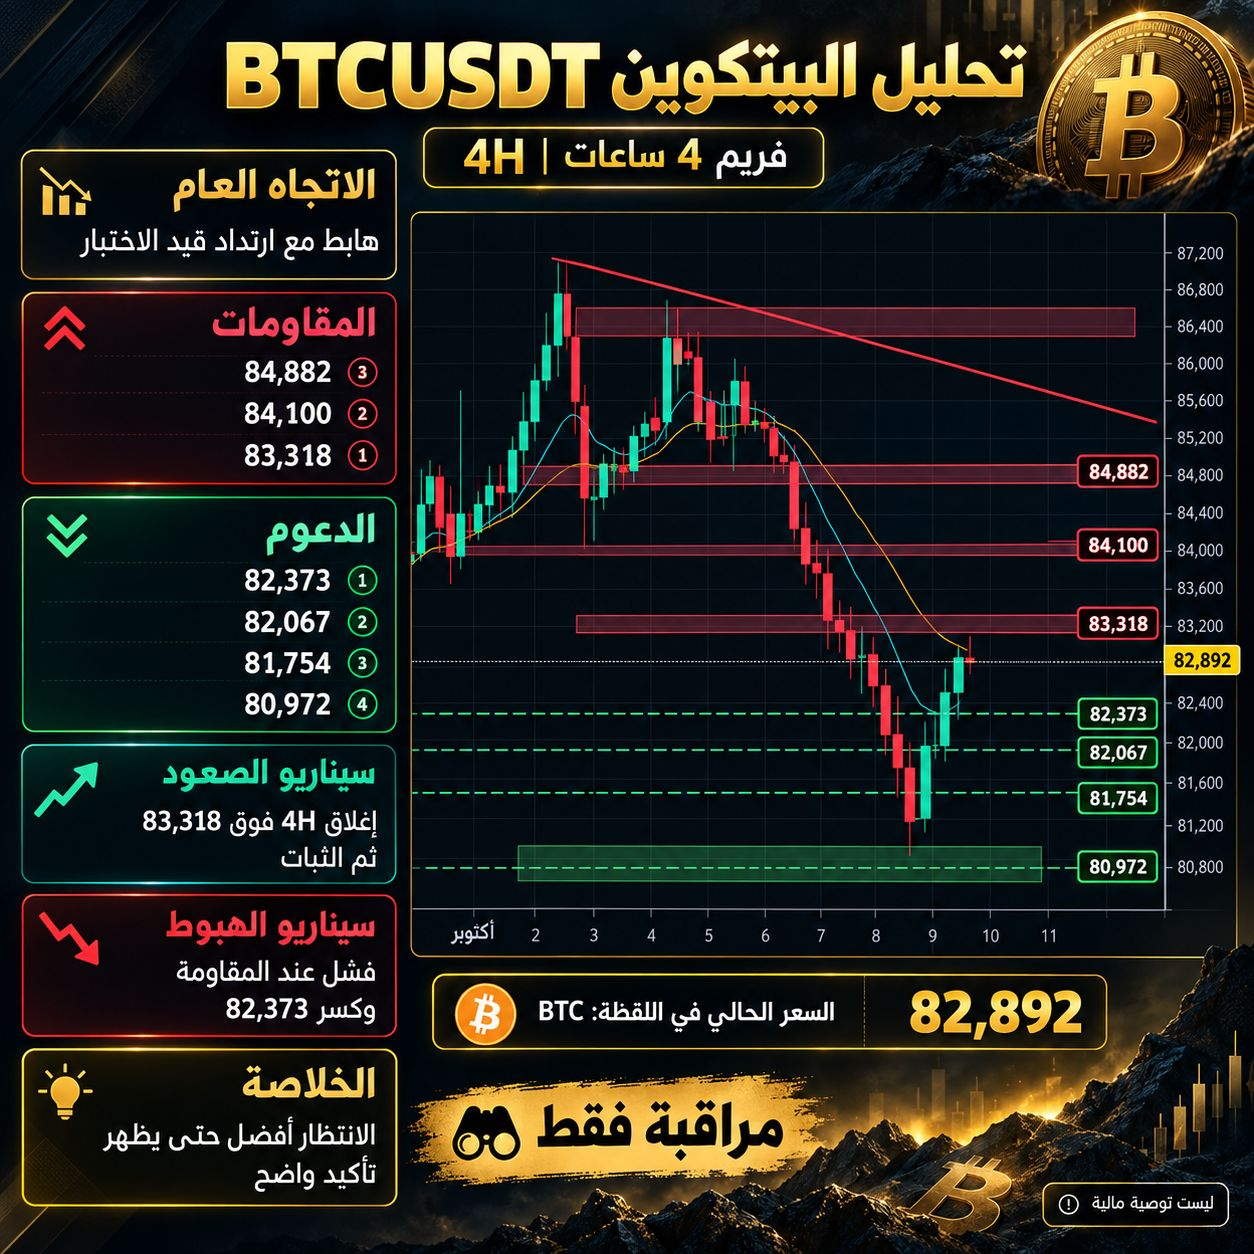
By monitoring the Smart Levels + ICT indicator, which combines supply and demand zones, liquidity, and technical levels, we can see that Bitcoin is trying to recover after a strong sell-off.
But there’s an important point: not every upward bounce signals a trend reversal!
🔴 First: Overall trend
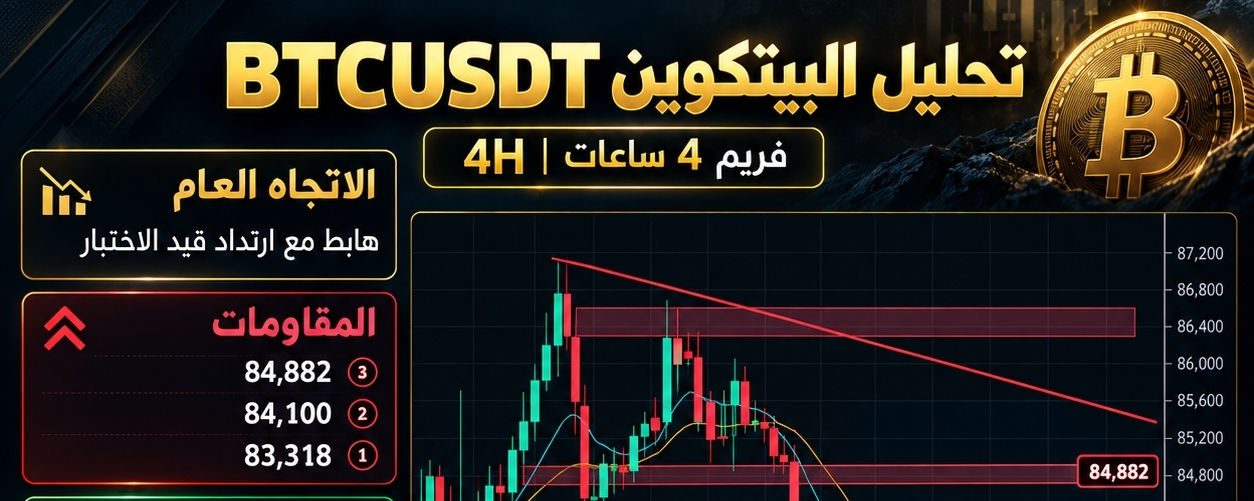
The trend on the 4-hour timeframe is still bearish, and the price is moving below a clear descending trendline.
The recent rise from the $80,600–$80,900 area is considered a technical rebound until the price proves it can break through resistance.
🟢 Second: Key support zones
These are the levels where we’ll watch for buyers’ reactions:
- $82,373: Nearby support.
- $82,067: Important rebound support.
- $81,754: Control zone.
- $80,972: Lower support zone.
🔴 Third: Key resistance levels
- $83,318: The buyers’ first real test.
- $84,100: Important technical resistance.
- $84,882: A supply zone where selling pressure may emerge.
🚀 Fourth: When does the bullish scenario become stronger?
We need a 4-hour candle to close above $83,318, followed by the price holding above that level. Ideally, strong trading volume should confirm the breakout.
If that happens, $84,100 and then $84,882 become potential technical targets.
📉 Fifth: When is further downside more likely?
If the price fails to break through the $83,318 resistance and then breaks below $82,373 with a 4-hour close, we may see a retest of $82,067, then $81,754, and possibly $80,972.
⚠️ Sixth: What should we do now?
The price shown in the image is $82,892, which was the reading when the chart was captured and is not a live price.
Personally, I prefer to watch and wait for confirmation rather than enter based on a single rebound candle.
💡 Summary:
The market doesn’t reward those who enter first, but those who enter with a clear plan and disciplined risk management.
Watch these two important levels:
🟢 $83,318 — A breakout and hold above this level would strengthen the bullish scenario.
🔴 $82,373 — A 4-hour close below this level would strengthen the bearish scenario.
What do you think? 👇
Do you expect a breakout above $83,318 and a move toward $84,100, or a return to test $81,754?
Share your analyses with me in the comments.
#Bitcoin #BTC #BTCUSDT #البيتكوين Coin #Technical_Analysis #ICT #SMC
This post is for educational purposes and is not financial advice.