$RLC Market Analysis | October 9, 2026 🚀
🔥 Market Overview:
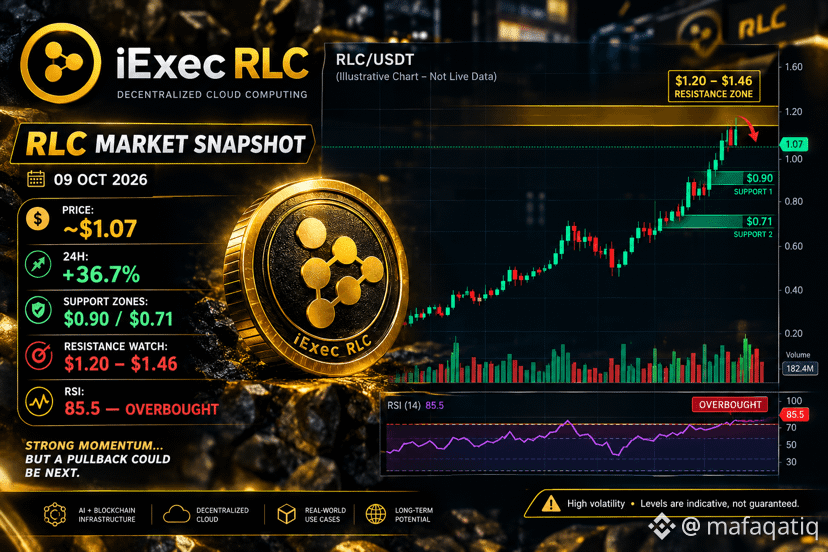
RLC is showing strong bullish momentum after a sharp price rally. With the price around $1.07 and a reported 24-hour gain of 36.7%, traders are watching closely for the next major move. However, elevated RSI levels suggest the market may be overbought, increasing the possibility of short-term profit-taking.
📈 Key Support Levels:
🟢 $0.90 — First support zone
🟢 $0.71 — Major downside support zone
🚀 Key Resistance Levels:
🔴 $1.20 — Immediate resistance
🔴 $1.46 — Major resistance and breakout level
📊 Technical Outlook:
• Bullish momentum remains strong, but volatility is elevated.
• A confirmed breakout above $1.20 with strong volume could open the way toward $1.46.
• Failure to hold support may trigger a pullback toward $0.90 or potentially $0.71.
• An overbought RSI does not guarantee a reversal, but traders should remain cautious after such a rapid rally.
🎯 My Market View:
RLC is at a critical technical zone. A sustained breakout could strengthen the bullish trend, while rejection near resistance may lead to consolidation or a correction. Waiting for confirmation is safer than chasing a sudden pump.
#FedMinutesFocusOnOctoberPause #IMFSaysTokenizedMarketsSmall #VitalikWarnsAICouldWeakenCryptographySecurity #BitcoinDipsBelow$81K
🔥 Market Overview:
RLC is showing strong bullish momentum after a sharp price rally. With the price around $1.07 and a reported 24-hour gain of 36.7%, traders are watching closely for the next major move. However, elevated RSI levels suggest the market may be overbought, increasing the possibility of short-term profit-taking.
📈 Key Support Levels:
🟢 $0.90 — First support zone
🟢 $0.71 — Major downside support zone
🚀 Key Resistance Levels:
🔴 $1.20 — Immediate resistance
🔴 $1.46 — Major resistance and breakout level
📊 Technical Outlook:
• Bullish momentum remains strong, but volatility is elevated.
• A confirmed breakout above $1.20 with strong volume could open the way toward $1.46.
• Failure to hold support may trigger a pullback toward $0.90 or potentially $0.71.
• An overbought RSI does not guarantee a reversal, but traders should remain cautious after such a rapid rally.
🎯 My Market View:
RLC is at a critical technical zone. A sustained breakout could strengthen the bullish trend, while rejection near resistance may lead to consolidation or a correction. Waiting for confirmation is safer than chasing a sudden pump.
#FedMinutesFocusOnOctoberPause #IMFSaysTokenizedMarketsSmall #VitalikWarnsAICouldWeakenCryptographySecurity #BitcoinDipsBelow$81K