

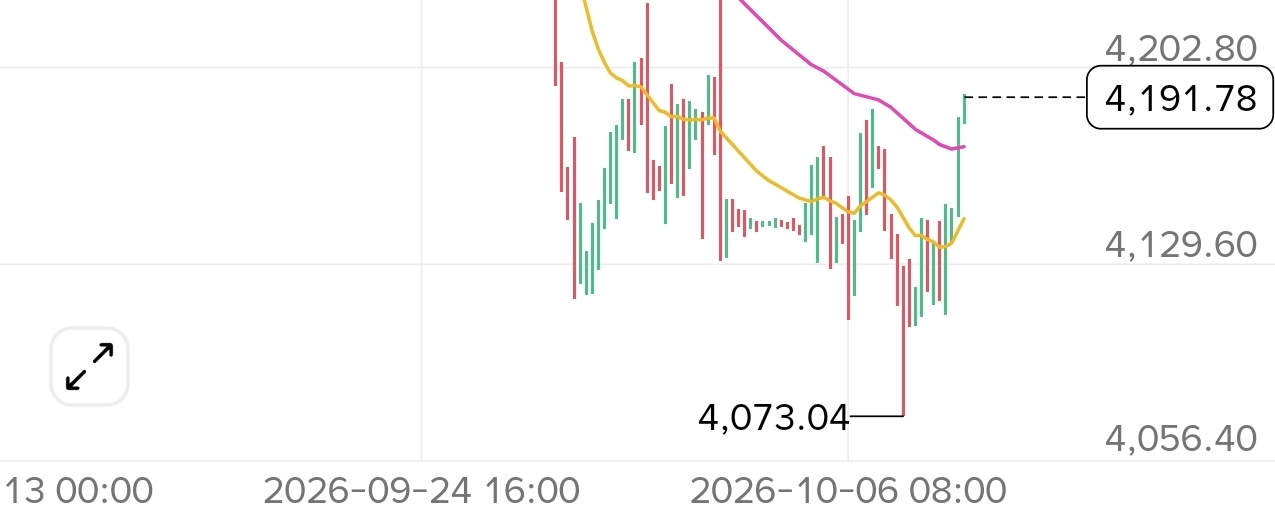

Gold has rebounded nearly $120—is 4073 the bottom?
On this 4-hour XAUUSDT chart, the price has rebounded from 4073 to around 4192 and is now back above the EMA20 and EMA69, showing some short-term recovery.
For now, though, I see this as a rebound after a decline. A reversal needs more confirmation: the EMA69 and EMA199 are still trending downward, and the price has yet to reclaim the area around the EMA199.
Next, I’ll be keeping a close eye on three levels:
① Around 4200: First, watch whether the price can hold above this level after breaking through, or whether it will pull back after a brief spike.
② Around 4250: Near the EMA199 shown in the screenshot, this is a level to watch to see whether this rebound can further repair the trend.
③ 4170–4145: This area is close to the two shorter-term moving averages in the screenshot, so it’s worth watching how price behaves on a pullback. If it loses this area again, the strength of the rebound will need to be reassessed.
Let me make my criteria clear first: I’ll become more confident in a reversal only if price holds on a pullback after breaking out and then forms a higher low. If it spikes higher and then falls back into the previous range, I’ll lower my expectations for the rebound to continue.
Do you think 4073 is a short-term bottom, or just a rebound during the decline? Feel free to share your reasoning.
Follow me, and in the next post I’ll review these three levels again to see which calls held up and which need revising.
The above is based solely on the market structure shown at the time of the screenshot.