

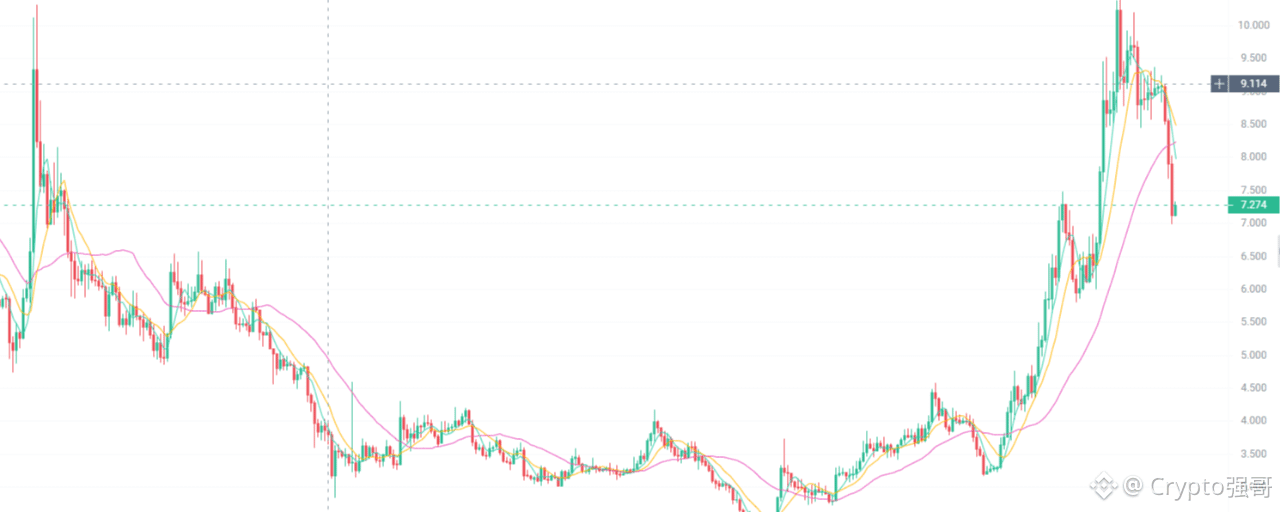

What makes $UNI (Uniswap) worth watching closely today is not how far the price has fallen, but whether meaningful buying support emerges after the decline and whether bulls can push the price back above key resistance levels.
Based on publicly available technical indicators on October 9, UNI is still facing fairly significant selling pressure in the short term. Some indicators are nearing oversold territory, but being oversold does not necessarily mean the price will rebound right away.
The core strategy today is to look for short-term oversold-bounce opportunities, watch for trend repair on the 4-hour chart, and assess the medium-term structure on the daily chart. The bias can lean toward looking for long opportunities, but expectations of a rebound after a decline must not be mistaken for a confirmed trend reversal.
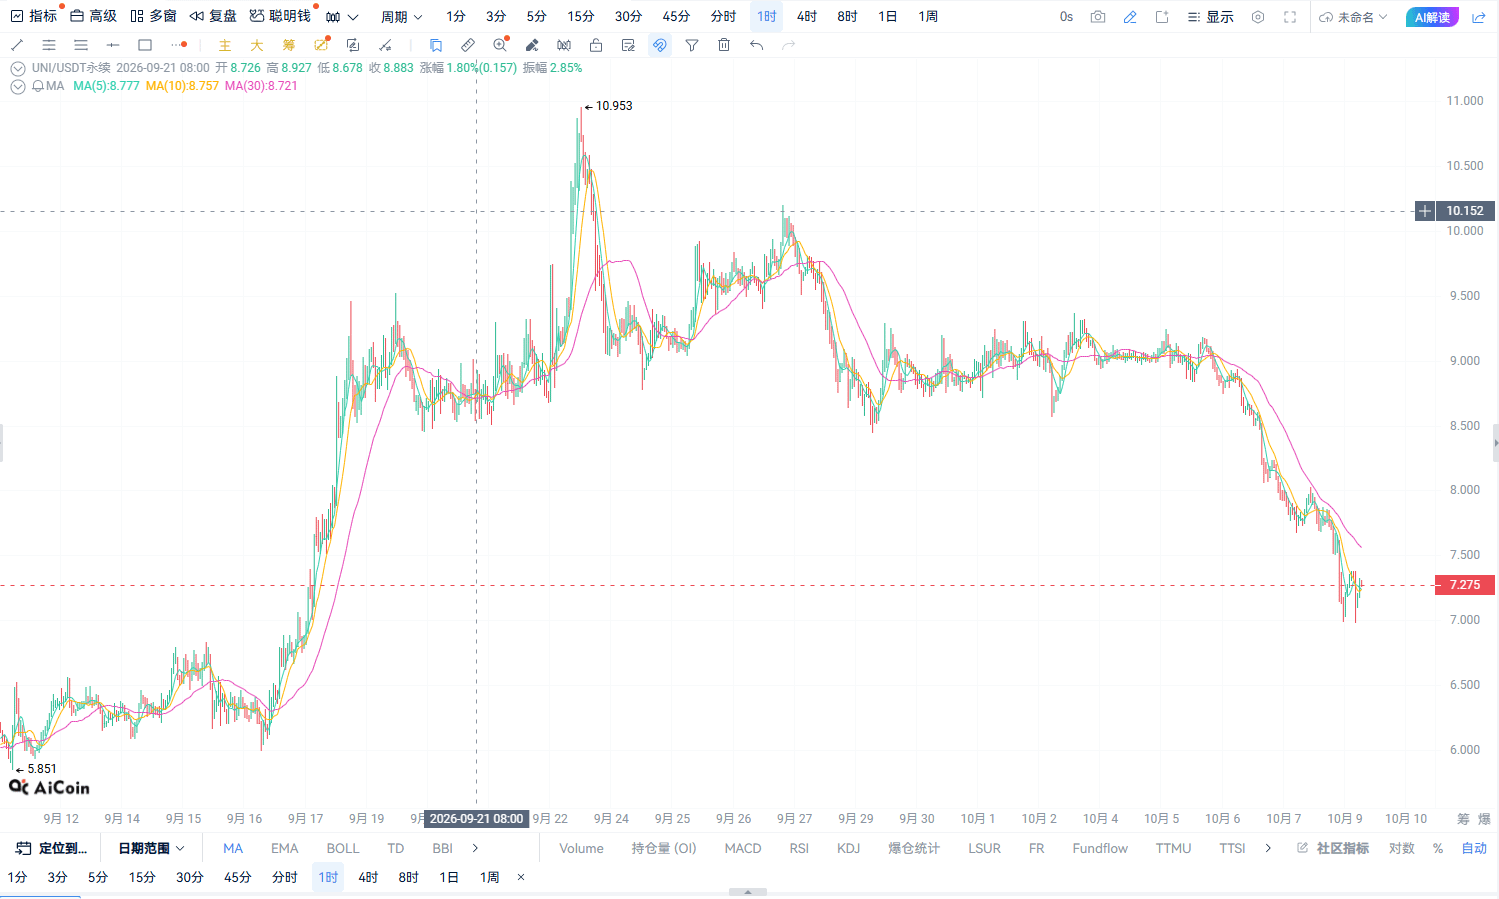
I. 1-hour chart analysis: An oversold rebound is worth watching, but wait for a signal
The 1-hour chart mainly determines the timing of short-term entries. Using 7.292 USDT as a reference price, the key things to watch are whether the price can find support and whether a rebound can form a higher short-term low.
According to publicly available technical analysis of UNI on the hourly chart, the short-term trend is weak and the RSI is in relatively weak territory. Although there are some signs of recovering momentum, the overall picture is not yet enough to confirm a trend reversal.
Support to watch: 7.20–7.30 USDT. Watch for clear buying support after a price pullback. If the lows gradually move higher, conditions for a short-term rebound will improve.
First resistance: 7.40–7.50 USDT. If the price breaks through on strong volume and holds above this zone, it may indicate that buying demand is beginning to recover.
Risk signal: If the price continues to break below 7.20 USDT and rebounds weakly, be alert to a further extension of the decline. Don’t add to your position blindly just because the price looks cheap.
My view is that the 1-hour chart may offer an entry point for a rebound, but a bottoming structure needs to be confirmed. A decline without a bottoming signal should not simply be treated as a buying opportunity.
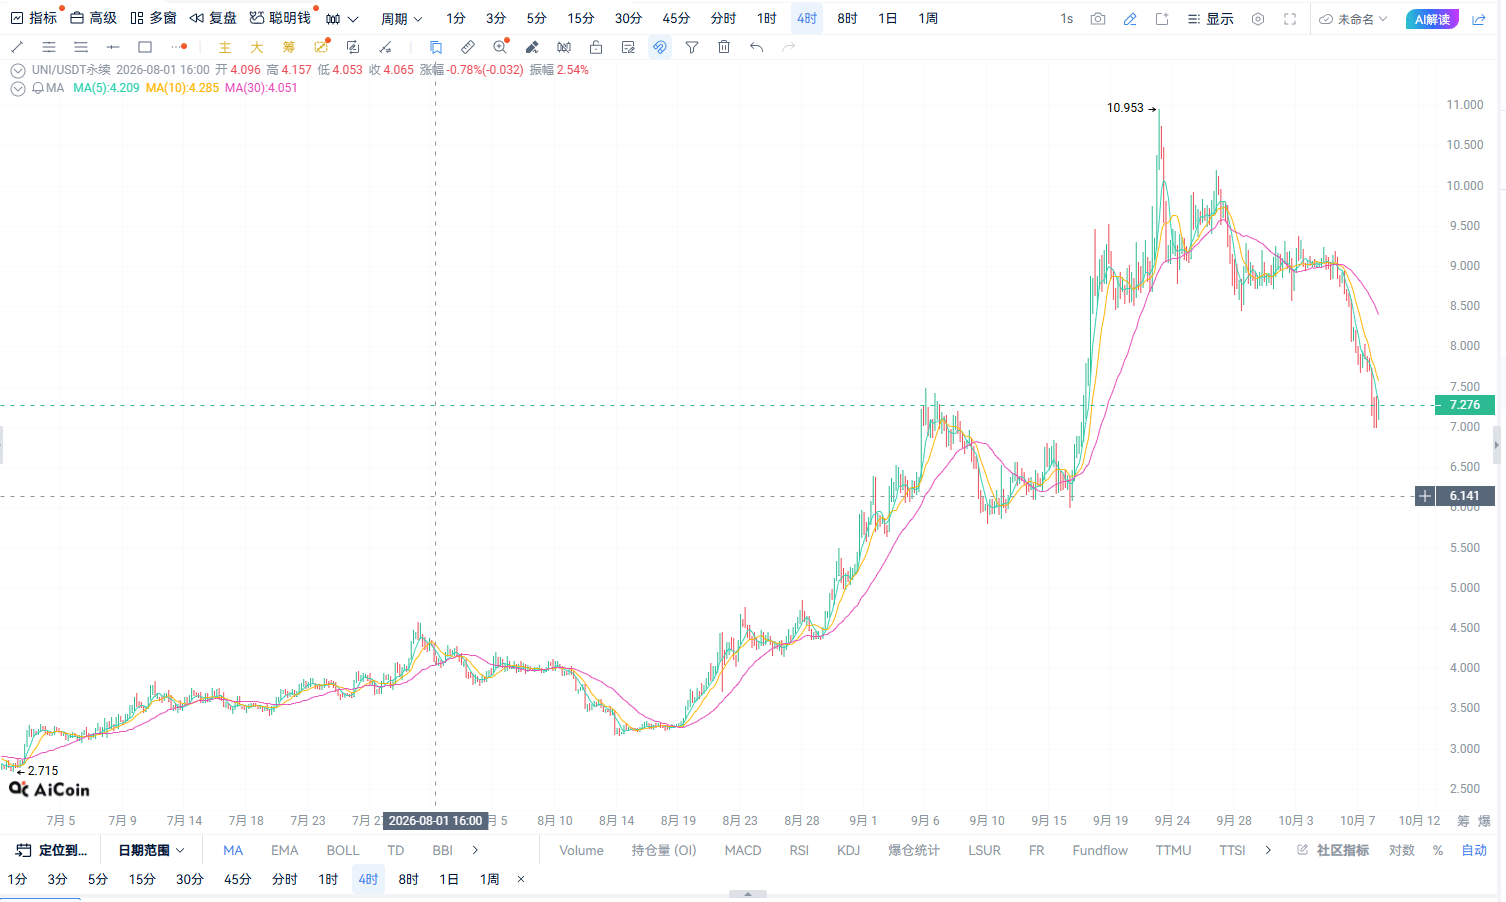
II. 4-hour chart analysis: The trend has not reversed; $7.50 is a key level to watch
The 4-hour chart is an important timeframe for judging whether UNI’s short-term rebound can develop into a broader trend recovery.
Publicly available technical data indicates that UNI remains bearish on the 4-hour chart, with short-term moving averages and momentum indicators under pressure. This means that even if a rebound occurs, it may face selling from holders who bought at higher prices.
Focus on three key zones next:
7.00–7.20 USDT: Lower support zone to watch. If the price pulls back into this zone, finds support, and does not continue falling on rising volume, it may establish a basis for a short-term rebound.
7.40–7.50 USDT: First resistance zone to watch. If the price can break through this area decisively, the short-term structure may gradually improve.
7.70–7.90 USDT: resistance zone for a further rebound. If bullish momentum continues, watch whether the price can move toward this area, but do not assume in advance that it will reach it.
Key takeaway from the 4-hour chart: look for a bottom first, then a breakout. If UNI remains capped by the moving averages and the rebound lacks strength, the current rise is more likely to be a recovery within a downtrend than the start of a new uptrend.
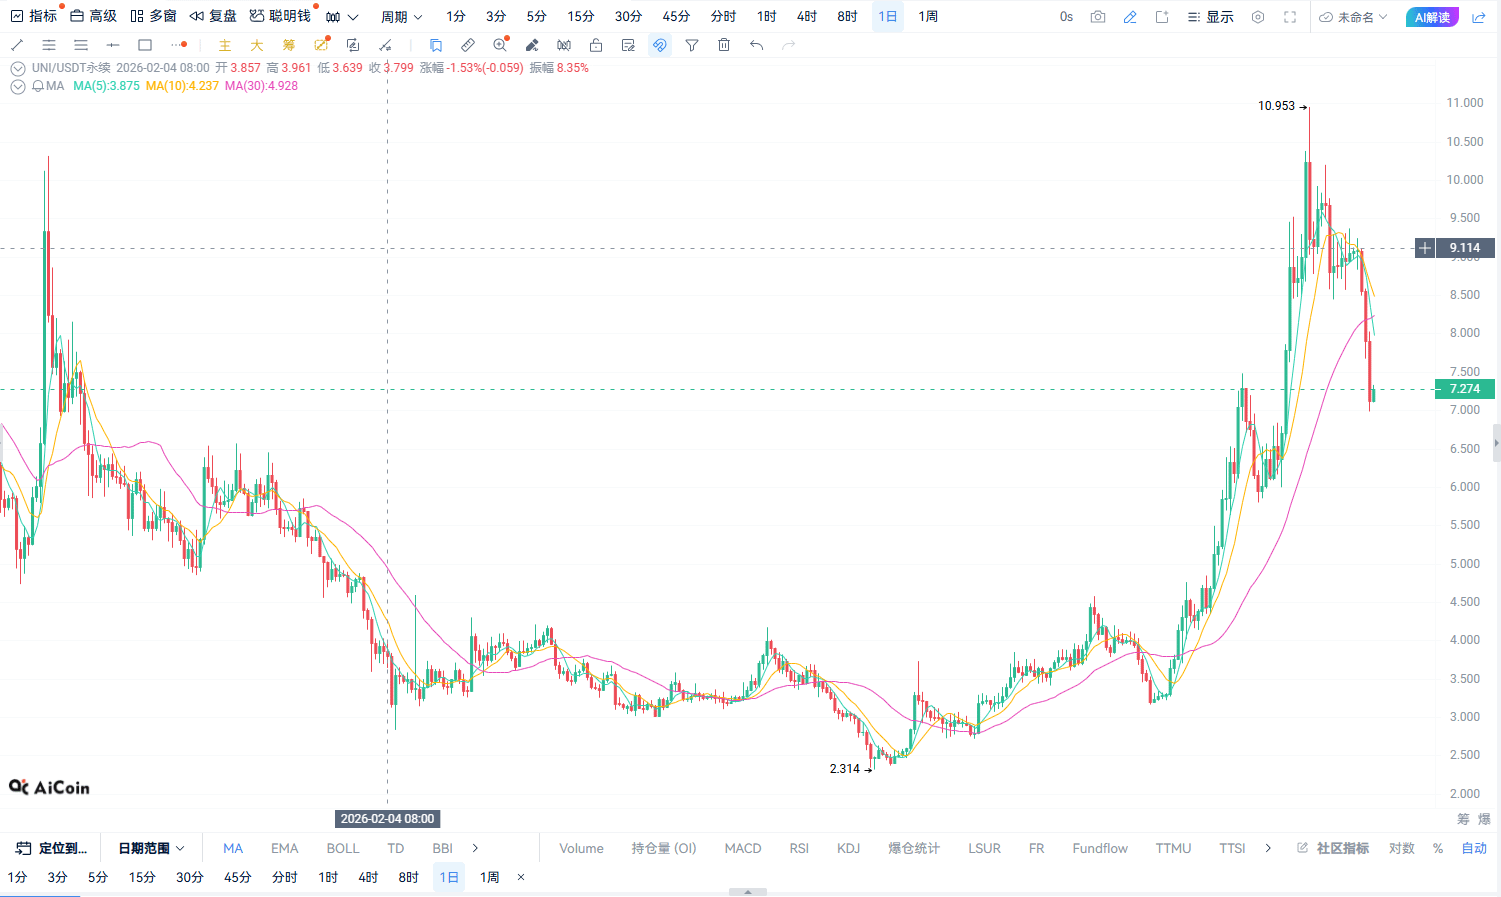
III. Daily chart analysis: The medium-term structure needs to recover; don’t mistake oversold conditions for a bottom
The daily chart determines how we view UNI’s medium-term outlook.
Recent market action shows that UNI encountered significant selling pressure again after its previous rebound, and the price has fallen below some important support zones. Public market analysis has also identified 8.20–8.90 USDT as a structural support zone to watch. The break below this area has weakened the short-term outlook.
Key points to watch on the daily chart:
First, can the area around $7 attract solid buying support? This zone can serve as a reference for assessing whether buying demand is returning, but it does not mean the price will necessarily find a bottom here. If support breaks decisively, reassess the downside potential.
Second, can the price reclaim and hold above $7.50? If UNI can gradually recover short-term resistance levels and form a sustained daily-chart recovery pattern, this may indicate improving market sentiment.
Third, can the price further reclaim the 8.00–8.20 USDT zone? This is an important area to watch when assessing whether the medium-term trend can improve. Only after the price reclaims and holds above key levels is there stronger reason to consider a recovery in the medium-term trend, rather than simply trading a single rebound.
My view on the daily chart is that short-term rebound opportunities may be worth exploring, but the medium-term trend still needs confirmation. Don’t assume a bottom has formed just because indicators are nearing oversold levels, and don’t keep averaging down in a downtrend.
IV. Summary of UNI trading strategy for October 9
Short-term strategy: Cautiously look for long opportunities
Focus on whether the price can find support around 7.20–7.30 USDT. Reassess rebound opportunities only after clear buying support appears.
Breakout confirmation: Watch 7.40–7.50 USDT
A decisive breakout and hold above this zone would help repair the short-term structure. If the rebound lacks volume, remain alert to another pullback.
Risk management: Don’t hold losing positions or add to positions blindly
The short-term trend is weak, so set a clear stop-loss before trading. Leverage in futures amplifies losses, so control your position size and avoid major losses from a single mistaken judgment.
V. Live trade (open directly at the current price)
UNI/USDT Live Trading Plan
Long
Reference entry price: 7.292 USDT
Order direction
Long
Entry price
7.292
Stop-loss price (-1.5%)
7.183
First take-profit (+1%)
7.365
Second take-profit (+2%)
7.438
Summary: On October 9, the key to trading UNI is to watch for genuine buying support after the oversold decline. A rebound is worth watching in the short term, but the 4-hour trend remains weak and the daily chart still needs further recovery. Opening a long position at the current price is a countertrend rebound trade, not a confirmed bullish signal. If the price continues to weaken before entry, prioritize skipping the trade rather than opening a position mechanically.
Truly professional trading is not about predicting the direction correctly every time. It is about executing decisively when you are right and exiting promptly when you are wrong.