


Daily update
Bitcoin traded back and forth in the 85,000–87,000 range for several days. The bulls tried several times to break above 87,000, but failed each time. The bulls simply weren’t up to the task—they had their chance but couldn’t deliver. It then turned around and broke below 84,000, reaching a low of around 82,200.
Bitcoin has not yet broken below the key levels of 81,000 and 80,000. At present, the general view is that there is a relatively high probability it has begun a daily-chart correction. Bitcoin had already shown a bearish divergence on the daily chart as early as September 30, and another bearish divergence appeared on the 2-day chart this morning. It has fallen below the middle Bollinger Band, and the current structure appears to be nearing its end.
It is about to enter mid-October. The probability is quite high that the market will continue to range and decline through the end of the month or into early November. If you don’t have spot holdings, you might as well wait until early November to come by and pick up cheap coins—taking a month off first is a good option
Mid-to-short-term trend direction
4h cycle main direction: This short-term move is the first 4h-level decline. Watch the pullback in the 76,000~75,000 zone. After that, there will still be a second 4h-level rebound and a third 4h-level decline
1h cycle direction: For now, in the current 1h decline, first watch whether it breaks below 80,000
BTC short-term
Because the market changes quickly on the short-term timeframe, the article can only make a forecast of how it changes at the time it is published. Short-term traders should pay attention to the latest changes in price action—this is only for reference
1H:
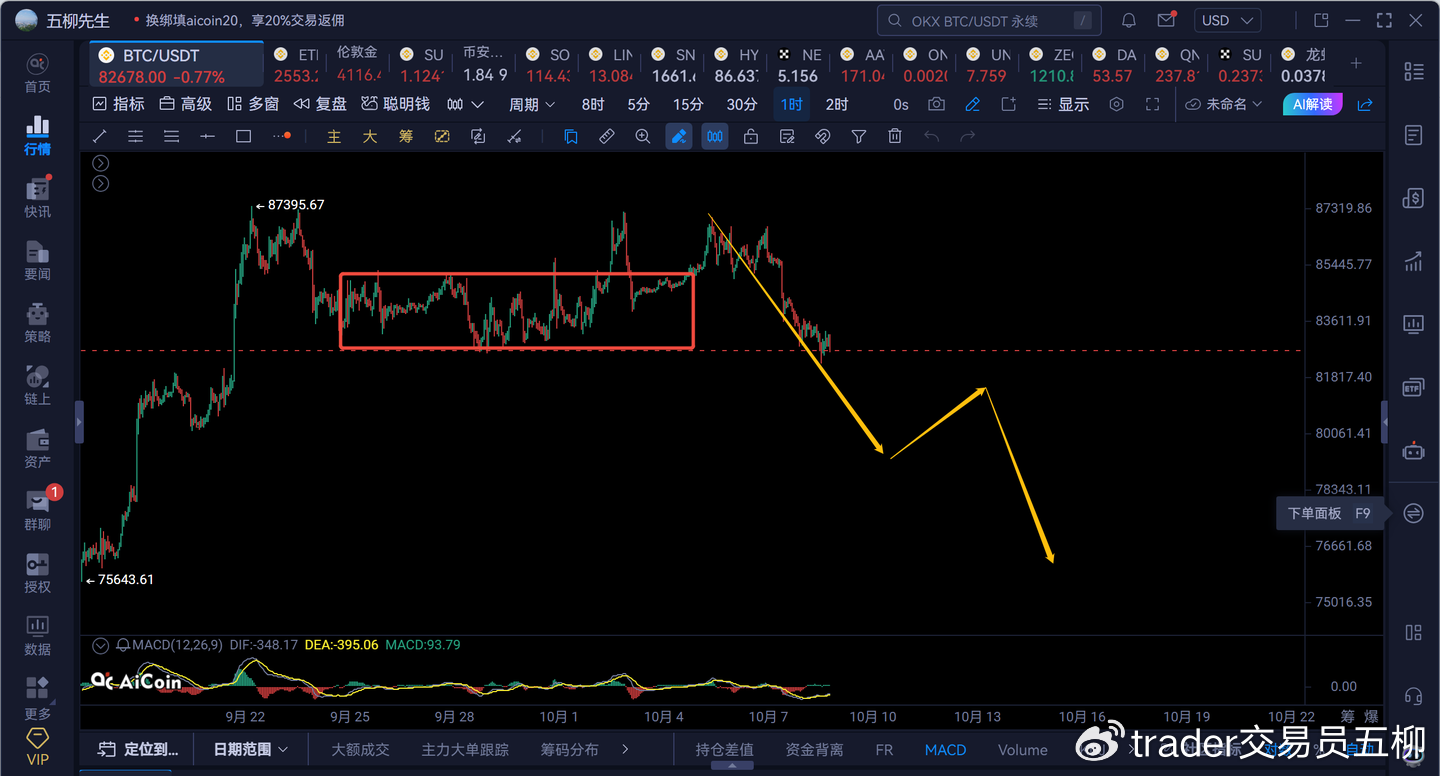
1)On the 1h timeframe, for now, consider it as the first 1h-level decline within the first 4h-level decline. So here, first observe whether the short-term breaks below 81000
2)If the short-term fails to break below 81000, then in the near term BTC may still complete a second 1h-level rebound toward around 84,000, and then begin a third 1h-level decline to below 78,000
3)If, on the short-term 1h timeframe, the decline breaks below 81000, then it will most likely break through the 80,000 level in one go. After that, the second 1h-level rebound may retrace to around 82000, and then the third 1h-level decline will go to below 76,000
4)For the current first 4h-level decline, a normal pullback should reach around 75,000. The third 4h-level decline is expected to be in the 68,000~72,000 range
5)For the daily timeframe pullback of BTC, as long as it does not fall below 68,000, then afterward there should still be a third daily-level rebound that reaches near 100,000, completing a weekly “small bull” scenario
15M:
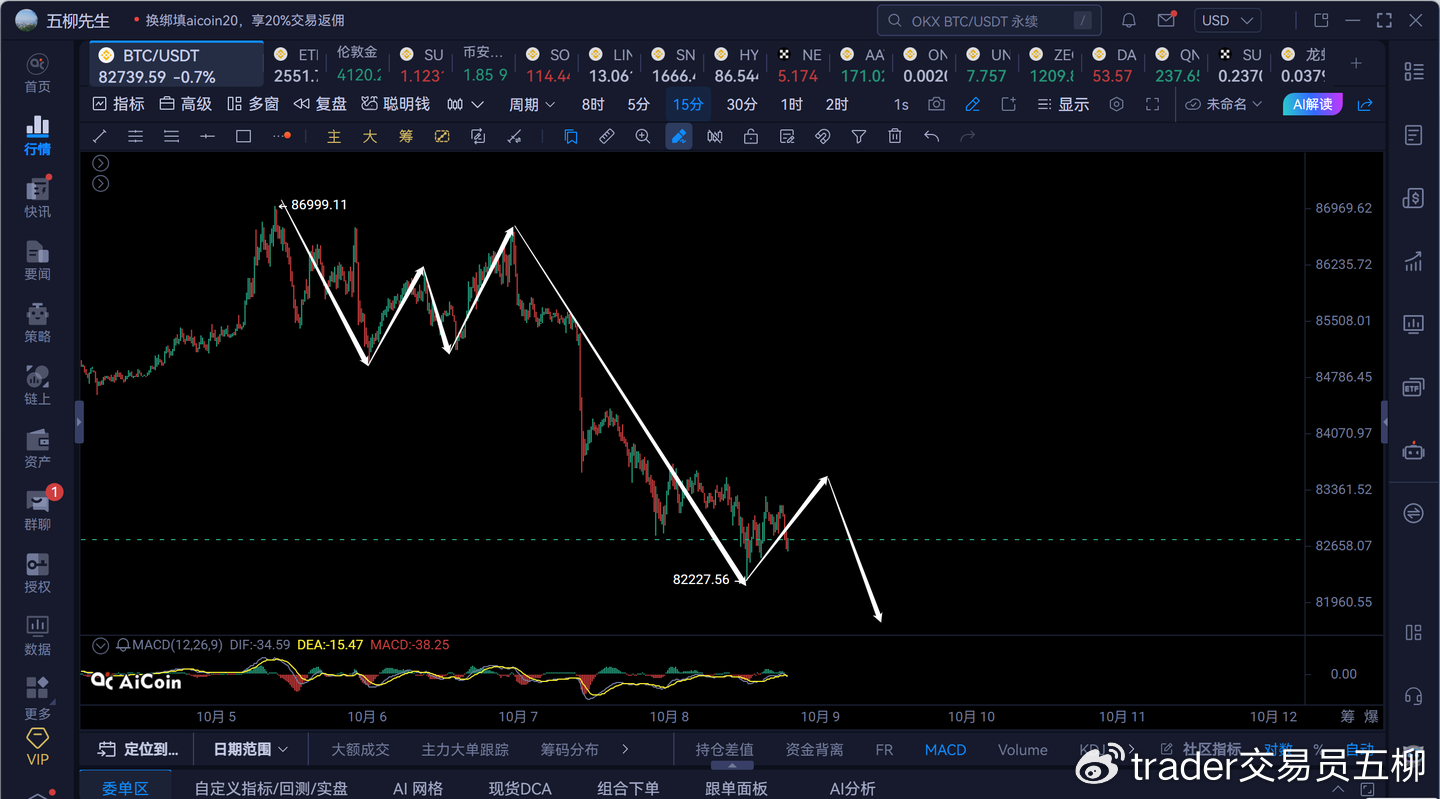
1)On a 15-minute timeframe, the short-term move here should be uncertain as to whether it will form a rebound from a 15-minute swing. If it does, watch 83500. After that, it may continue down to complete the next 15-minute decline, and watch whether it can break below 81000
2)Or, if it continues to range and decline here, it may extend the 15-minute-level decline and form a 5-minute timeframe sideways-to-down drifting bearish pattern
3)For the downside, you can first watch 81000. If this level breaks, I believe the 80,000 area will be broken very quickly. 80,000 is a psychological threshold for the market, or a monitoring point, but it is not truly a strong support. The real support zone is the 81000~82500 range
4)There is no market that only goes up without breaking. A staged big pullback is normal. Isn’t it better to wait for a “discount” opportunity?
ETH
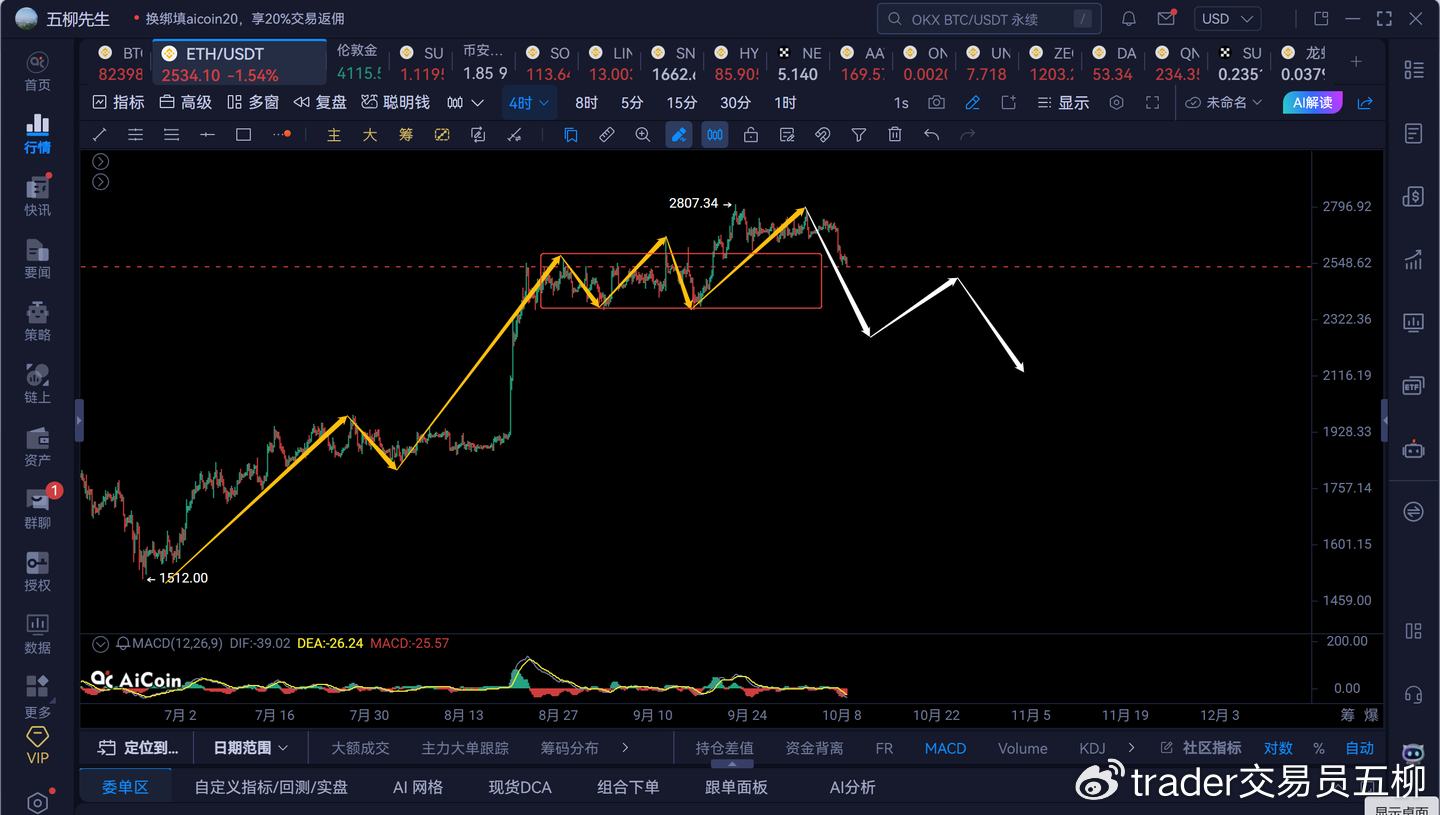
1)Ethereum has already fallen back below the upper boundary of the previous 4h-level consolidation. This basically confirms that the daily-level rebound trend for ETH from 1512~2800 has ended. On the short term, look for ETH to complete a daily-level decline, targeting the 2000~2200 range
2)As long as the daily pullback for ETH does not fall below 1970, then afterward there should still be a third daily-level rebound reaching 3600, and even 5000. But if it breaks below 1970, then you’ll need to see as it unfolds
3)The current first 4h-level decline has not finished yet. First look at the 2400~2300 range. After that, there will be a second 4h-level rebound and a third 4h-level decline
4)On the short-term 1h timeframe, it is still extending downward. Watch whether it breaks below 2480
5)Only after it breaks back above 2587 can it be confirmed that here begins the second 1h-level rebound
6)Wait patiently for cheap lots at the end of the month