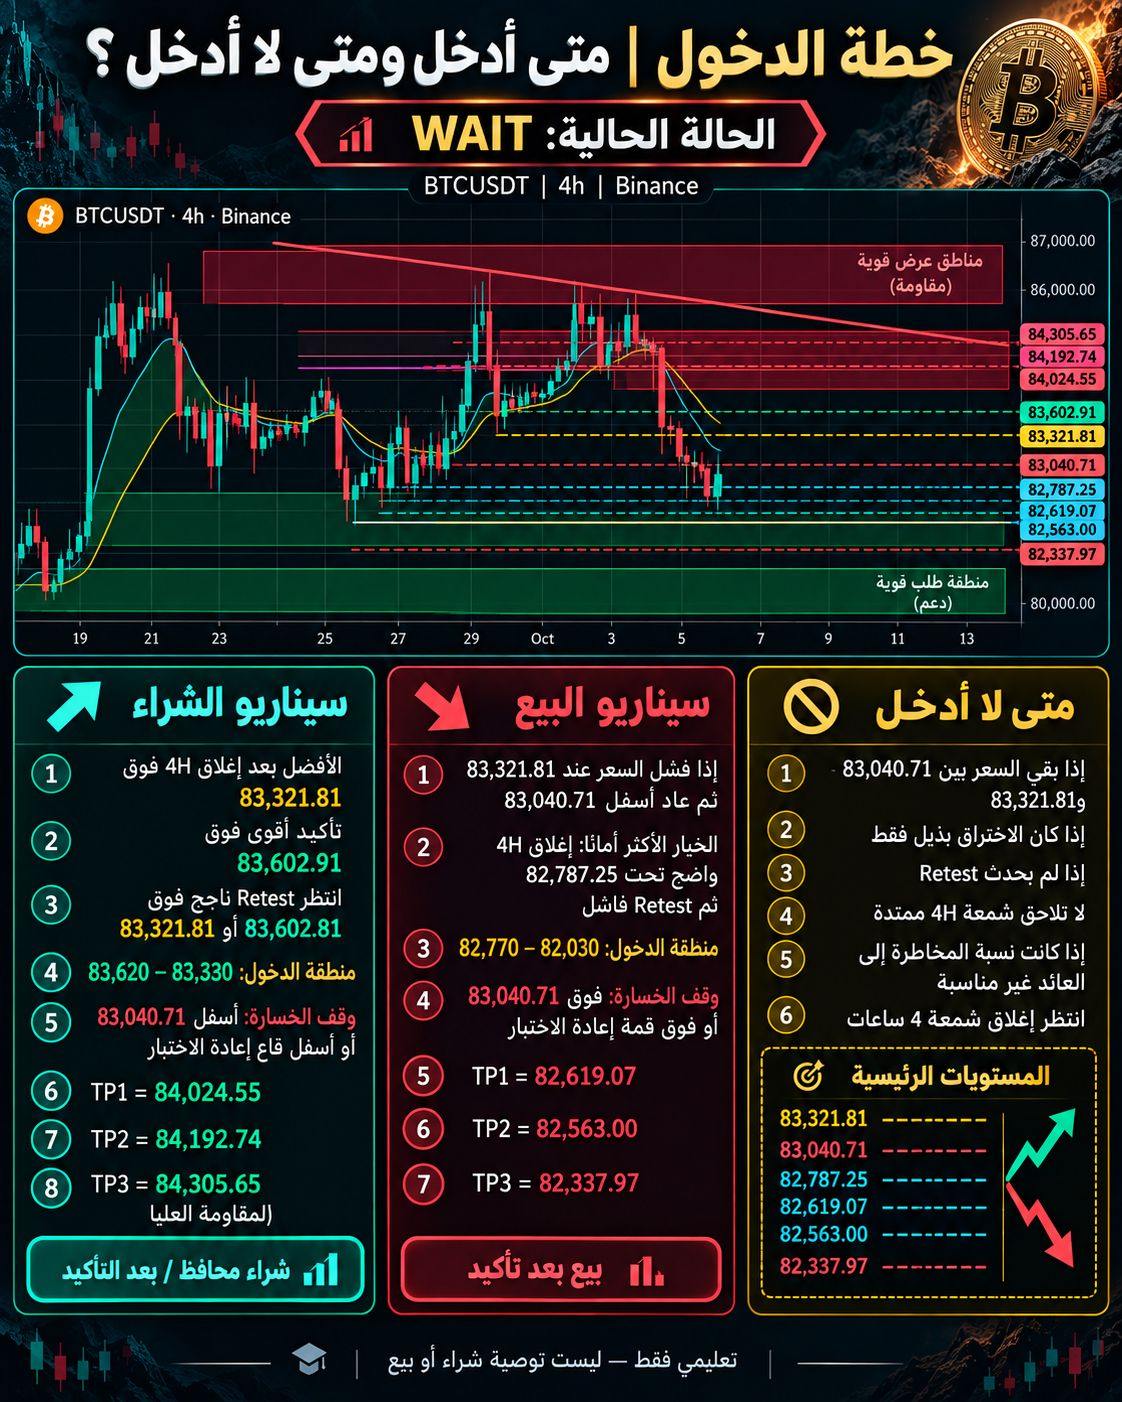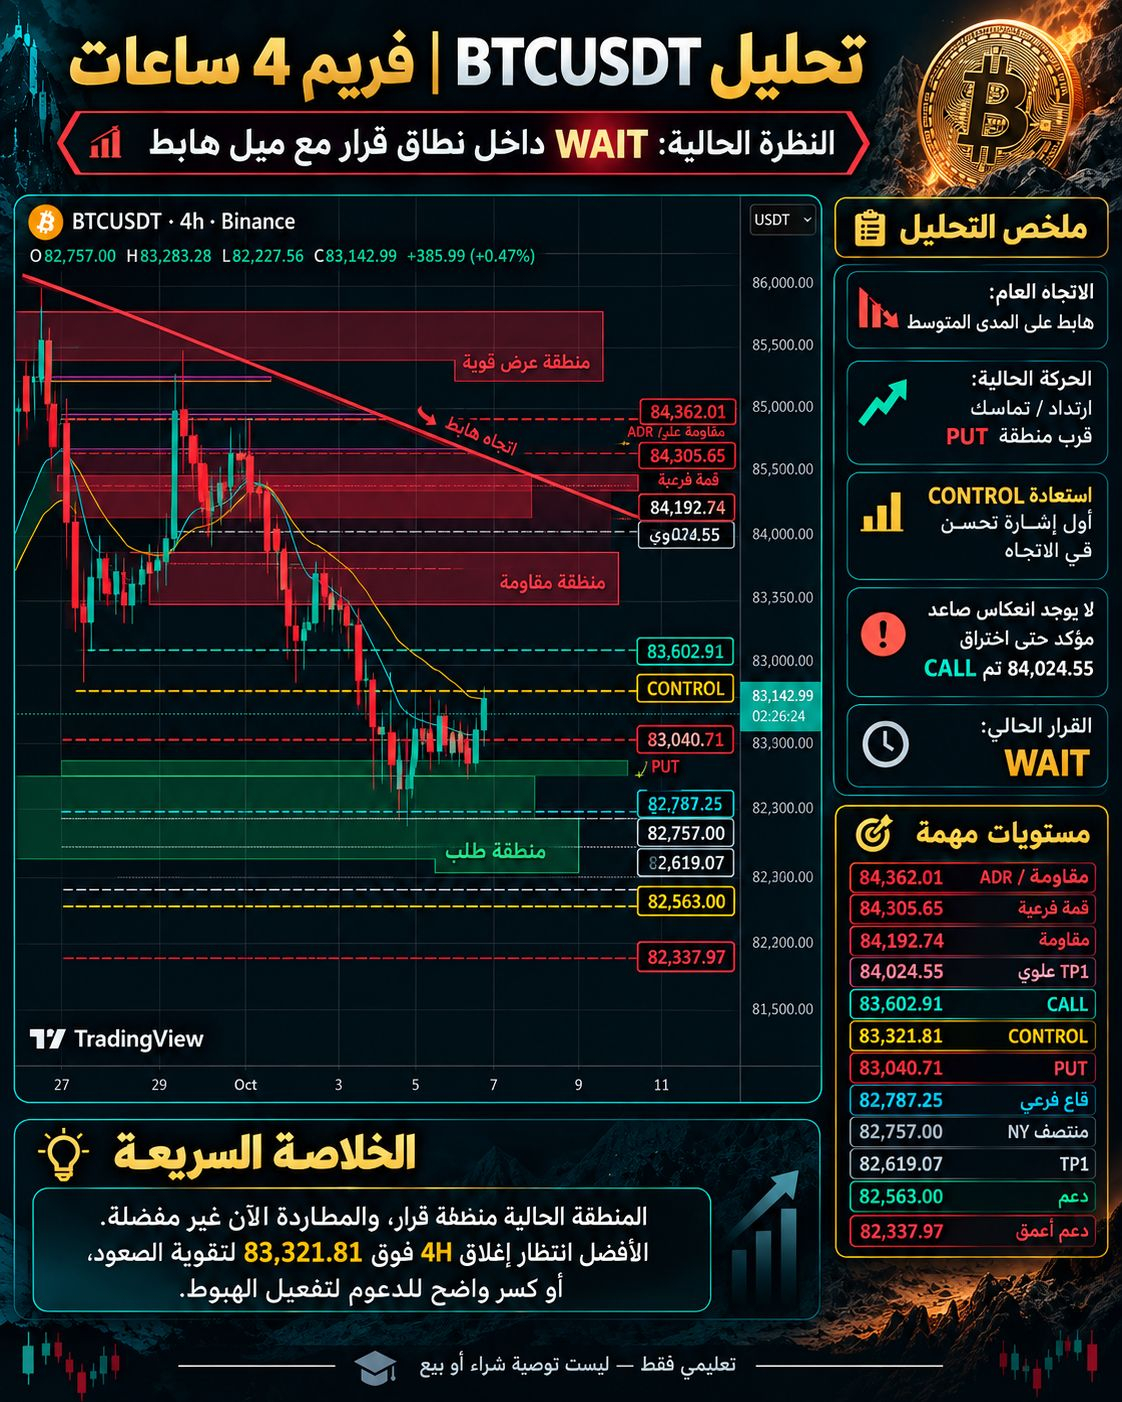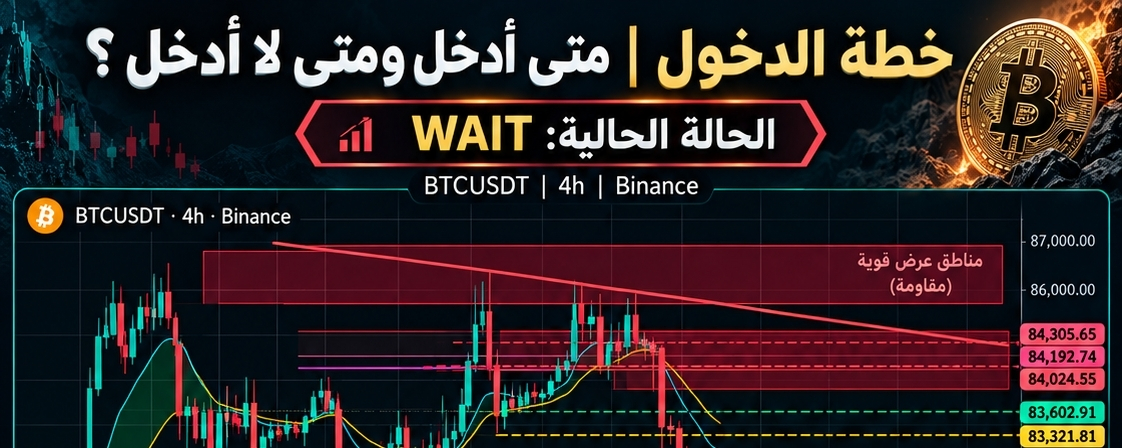

The chart shows that BTCUSDT is still within a decision range, so the current status is:
WAIT = Wait
This means the market is not currently in the best zone to chase either a buy or a sell, because the price is between key levels. Entering now without confirmation could involve uncomfortable risk.
First: What does the chart say about the trend?
Overall trend: bearish in the medium term.
Current movement: a rebound or consolidation from a support zone, but an upward reversal has not yet been confirmed.
There is an attempt to move higher, but price is still within a relatively weak structure.
Second: The key levels in the chart
These are the levels around which the decision revolves:
83,040.71 = PUT level
This is a very important level, and a break below it would weaken price.
83,321.81 = CONTROL level
This is the first very important level if price wants to improve its outlook.
83,602.91 = CALL level
A breakout above it would provide stronger confirmation that the trend is improving.
84,024.55
Upper target / first resistance after the uptrend is confirmed.
84,192.74 is higher resistance.
84,305.65 is a minor high / strong resistance.
As for the downside:
82,787.25 = important minor low
82,619.07 = bearish TP1
82,563.00 = support
82,337.97 = deeper support
Third: When should I enter a buy?
The chart presents a conservative buy scenario, not a random buy.
The best buy entry is when:
1. Price closes a 4-hour candle above 83,321.81
2. Even better if it breaks above 83,602.91
3. Then the broken level is successfully retested
Do not buy just because price bounced from the low,
Instead, buy after confirmation.
The intended buy-entry zone in the chart:
Approximately after a breakout above 83,321.81 or 83,602.91, followed by a successful retest.
Stop loss:
Below 83,040.71
Or below the retest low
Upside targets:
TP1 = 84,024.55
TP2 = 84,192.74
TP3 = 84,305.65
Fourth: When should I enter a sell?
The chart also presents a sell scenario after confirmation.
Selling makes sense if:
1. Price failed at 83,321.81
2. Then returned below 83,040.71
3. The safer option: a clear break and 4-hour close below 82,787.25
4. Then a failed retest occurs
This means:
If price cannot hold above CONTROL, then starts breaking support levels again,
At that point, the bearish scenario comes back into focus.
Stop loss:
Above 83,040.71
Or above the retest high
Downside targets:
TP1 = 82,619.07
TP2 = 82,563.00
TP3 = 82,337.97
Fifth: When should I stay out?
And this is the most important part of the chart.
Do not enter if:
1. Price remains between 83,040.71 and 83,321.81
2. If the breakout is only a wick, without a clear close
3. If there is no retest
4. If the candle is very extended and you are late
5. If the risk-to-reward ratio is not favorable
6. If the 4-hour candle has not closed yet
In short:
The current area is a zone of indecision, not a strong decision zone.
The summary to share with your followers
You can put it to them this way:
$BTCUSDT on the 4-hour timeframe is still in a decision zone.
Current outlook = WAIT.
Buying becomes preferable only after a 4H close above 83,321.81, with stronger confirmation above 83,602.91.
Selling becomes strongly relevant again if price fails at resistance, then returns below 83,040.71. It becomes clearer with a break below 82,787.25.
For now, it is best not to rush and to wait for confirmation, because the market is between support and resistance. Any entry now without a clear signal could involve uncomfortable risk.
For educational purposes only — not a recommendation to buy or sell.