
In my first two articles, I tested Rayls’ proof code on a cloud server, but the numbers came from just one type of machine, and the test code wasn’t available somewhere readers could easily reproduce the results. This time, I’ve made the test code public on GitHub and had GitHub’s own servers run it instead. I tested three types of CPUs, and anyone can click through to view the logs.
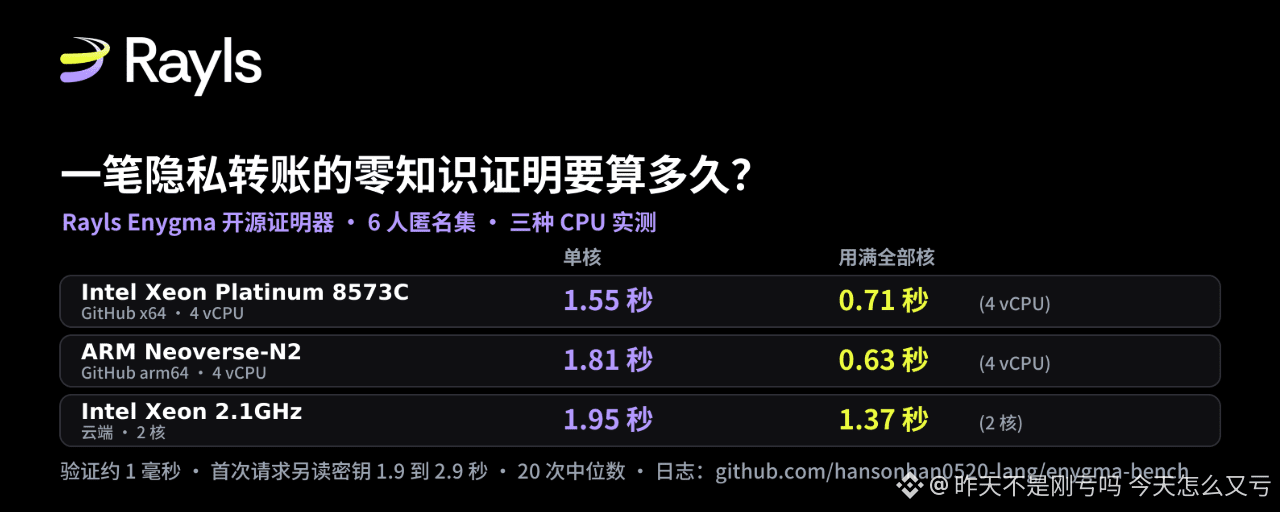
Here’s the short answer. Using the six-member anonymity set in Rayls Enygma’s private-transfer circuit as an example, generating a zero-knowledge proof for one transfer takes 1.55 to 1.95 seconds with a single vCPU, and 0.63 to 0.71 seconds with 4 vCPUs. Verifying the proof takes about 1 millisecond. The first time the service processes a transfer of a given size, it also takes an additional 1.9 to 2.9 seconds to load the proving key into memory. Assuming requests are processed serially, a 4-vCPU cloud server can generate 1.4 to 1.6 proofs per second.
Below I explain how these numbers were obtained, how they can be reproduced, and what they imply for how many machines an institution needs to prepare.
Why does a private transfer need to “compute”?
Zero-knowledge proofs can be understood as a piece of mathematical receipt: the payer does not reveal their balance, the amount, or the counterparty, yet can still prove to the network that this账 (transaction record) is correct. The trade-off is the compute required to generate this receipt. Rayls’s Enygma uses the Groth16 proving system. Its advantage is that proofs are small and verification is fast, but generating them requires lots of elliptic-curve computations. So the question “how much compute is needed for privacy” in practice really asks: how long does it take to generate the proof?
Here, k is the size of the anonymity set. In one transfer, k participating parties each generate a value commitment; the actual recipient is hidden among them, so bystanders can’t tell who paid whom. The larger k is, the deeper the hiding—and the larger the circuit. The Rayls repository’s load-testing script uses k=6, so the discussion below focuses mainly on k=6.
These conclusions are not only applicable to Rayls. Any system that uses Groth16 for private transfers will have costs in the same steps—only the circuit size differs.
How it was measured—anyone can reproduce it.
What was tested is Rayls’s open-source proof service, rayls-sovereign-gnark-api, commit 67c4c26. The circuit and proof code were changed in not a single line. My test code is in the public repository hansonhan0520-lang/enygma-bench; the script automatically pulls that commit, places the test files into its circuit directory, and calls the repository’s own proving function.
After the test code is put into the repository, GitHub runs it using its own cloud servers (GitHub Actions). Each full run log is automatically committed to the repository’s results folder. Readers can click “Run workflow” on the Actions page and run it again under their own accounts. GitHub documentation states that the standard Linux runner for public repositories is 4 CPUs and 16 GB of memory, in two variants: x64 and arm64.
This article uses three machines, and the CPU topology of each one is recorded in the logs via lscpu:
GitHub x64 runner: Intel Xeon Platinum 8573C. 4 vCPUs, but in fact 2 physical cores, 2 threads per core.
GitHub arm64 runner: ARM Neoverse-N2, 4 vCPUs, 4 physical cores, 1 thread per core.
My own cloud environment: Intel Xeon 2.1GHz, 2 physical cores.
On each machine, for each tier k=2 to 6, it first generates a proof and verifies it using the verification key, and then continuously times 20 runs to take the median. It tests with the available vCPUs limited to 1, 2, and 4 respectively; my machine only has 2. The numbers for the two GitHub machines come from running 37741247183 via Actions; the third machine comes from a local run on the same day. The numbers in the full text and the two figures are generated from the same data file.
What’s new—here it is clearly. The test data for k=3 to 5 reuse the generator I wrote in my previous post. That generator first reproduces Rayls’s official datasets for k=2 and k=6 field by field before the data is adopted; this time it wasn’t changed. What this added article contains is: a publicly reproducible test repository, 4 vCPU measurements on two new CPUs, and separate timing for key-loading time.
How much difference does it make with different CPUs?
Proof time for k=6 using only 1 vCPU: 1.55 seconds on Intel 8573C, 1.81 seconds on Neoverse-N2, and 1.95 seconds on my 2.1GHz Xeon—so the slowest is 26% slower than the fastest. After fully utilizing all vCPUs, the two GitHub machines are 0.71 seconds and 0.63 seconds respectively, and my machine with all 2 vCPUs is 1.37 seconds.
The verification time on all three machines is around 1 millisecond, from 0.98 to 1.28 ms. The proof itself is fixed at 164 bytes; the public data transmitted alongside the proof is 1,612 bytes when k=6. The three machines are completely identical on this.
How much faster multicore can be depends on whether the cores are truly available
This is the most unexpected result this time. From 1 vCPU to 2 vCPUs, both GitHub machines are about 1.88× to 1.89× faster—close to a doubling. But from 2 vCPUs to 4 vCPUs, the two diverge: Neoverse-N2 is faster by 1.51× again, while Intel 8573C is only 1.17× faster.
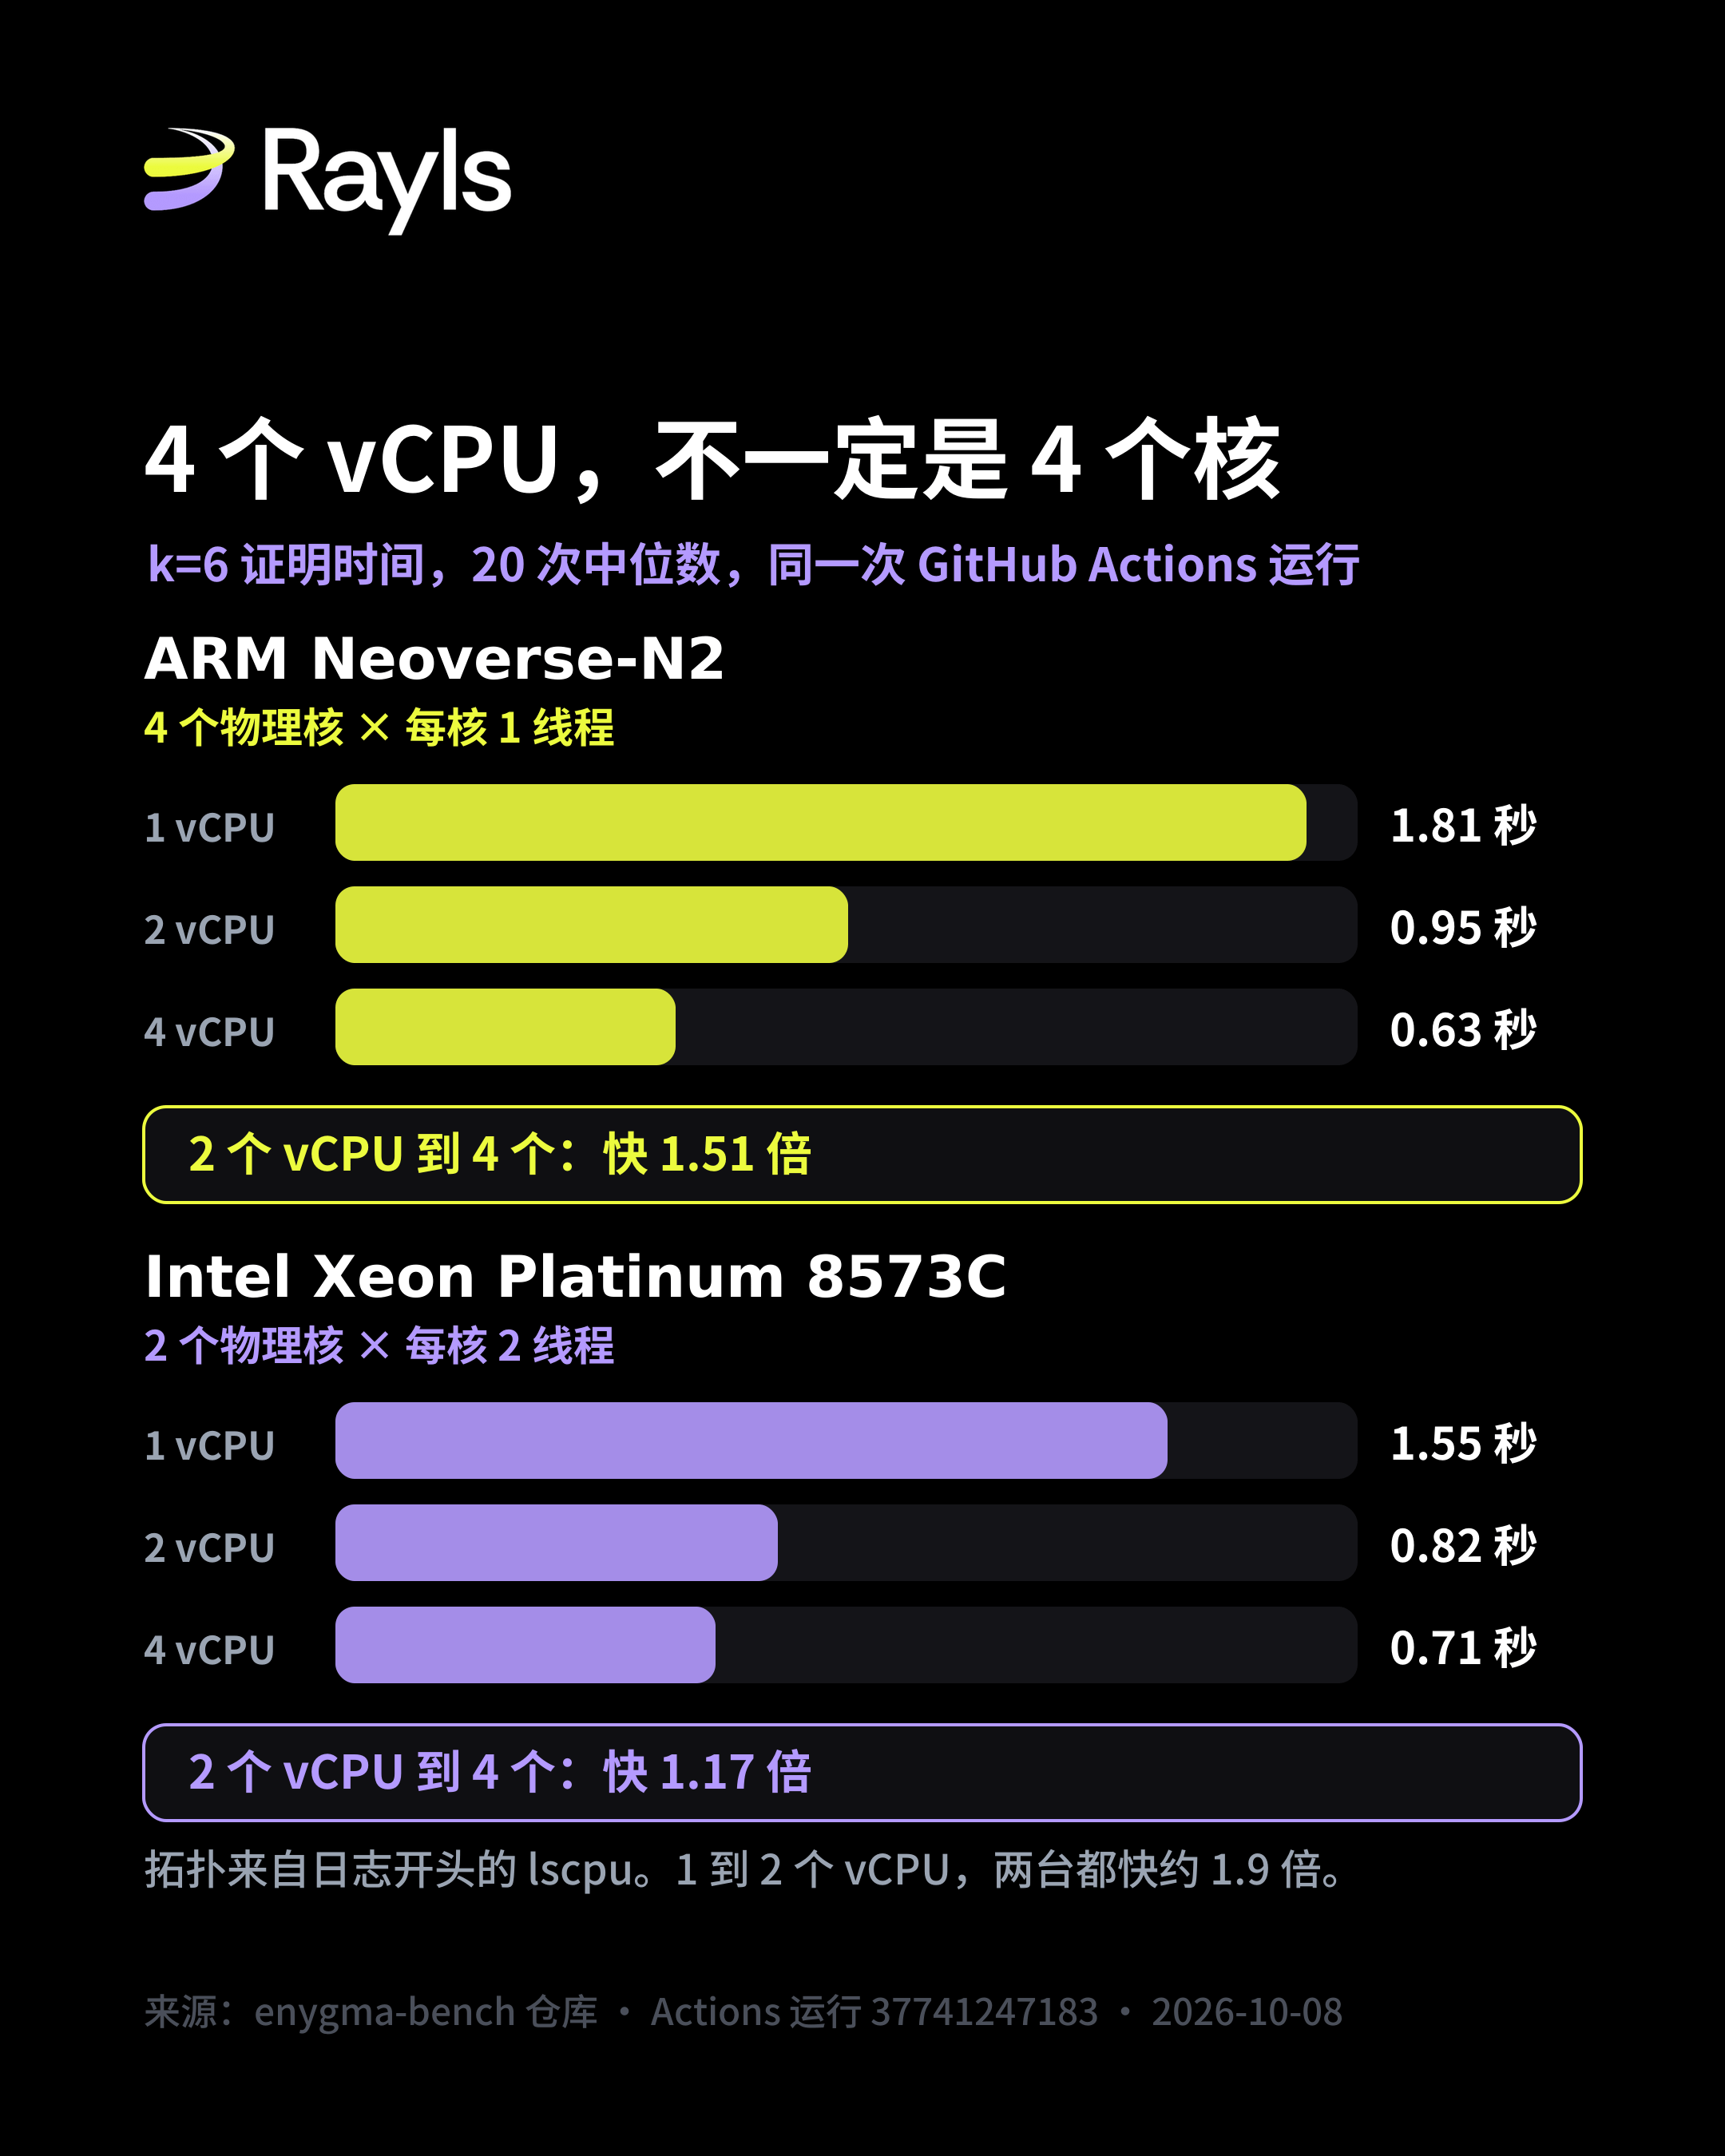
The difference between the two machines is clearly documented in lscpu. On Neoverse-N2, 4 vCPUs correspond to 4 physical cores; on Intel 8573C, 4 vCPUs correspond to 2 physical cores running 2 threads each. So on the Intel machine, “from 2 vCPUs to 4” doesn’t add physical cores—it just lets each core run an extra thread. The speedup matches the number of physical cores, which is the explanation I inferred from the topology records. I didn’t separately break out cache and frequency differences across CPUs.
Even with the same x64 runner label, the hardware assigned in two runs can differ. In an earlier run on the same day, it was assigned an AMD EPYC 9V45; going from 2 vCPUs to 4 vCPUs then was only 1.18× faster as well. But I didn’t record the topology that time, so I don’t treat it as evidence. When readers reproduce it themselves, the x64 runner may be assigned a different CPU—just check the lscpu at the start of the logs to know which kind.
I also corrected this in my own analysis: in my previous measurement in a cloud environment, using 2 vCPUs was on average only 1.64× faster (and I hadn’t clarified that this might just be a property of that particular machine). This time, in the same environment with k=6, it’s only 1.43× faster, while the two GitHub machines are close to 1.9×. So “doubling resources isn’t nearly doubling speed” looks more like a characteristic of that cloud machine and does not hold on the other two CPU types.
The step for the 6th participant: it changes with the CPU, too.
In the previous post, on a single machine I found that the step from k=5 to k=6 is much more expensive than each earlier step. This time all three machines reproduce that. With only 1 vCPU, each additional participant between k=2 and k=5 averages an extra 114–143 ms, while the step from k=5 to k=6 costs an extra 451–619 ms, which is 3.5 to 5.0 times the earlier average value.
The reason is the same as in the previous post: each additional participant increases the number of constraints by a fixed 8,112, but the proving system allocates the compute space according to powers of 2. So k=2 to 5 all stay within 65,536; when k reaches 6 and crosses the line, the compute space becomes 131,072. On three machines and two instruction sets, the numeric value of this compute space is exactly the same. The extra information this time is: the “step” comes from the circuit itself, not from the CPU.
Where is the cold start slow?
In my previous post, I measured that the service takes 2.5 to 4.5 extra seconds the first time it handles a request for a given size tier, and I attributed it to loading the proof keys, but I didn’t measure it separately. The reviewers pointed this out.
This time I timed two loading functions called on the service’s first request separately: one reads the constraint system, and one reads the proof key(s). They are the same set of functions used in the service code’s handler.go. At k=6, reading the proof keys takes 1.94 to 2.94 seconds on the three machines, while reading the constraint system takes only 0.05 to 0.08 seconds.
If you add the loading time to the cost of a single “warm” request, compared with the measured “cold” request, the two GitHub machines differ by 22 ms and 12 ms, and my machine differs by 0.2 seconds. So the cold start is basically the time to read the proof keys. The deployment implication is very direct: preload five key tiers when starting the service, or send a round of warm-up requests first; then the first real transaction won’t have to wait those extra 2–3 seconds.
How many machines does an organization need to prepare?
This section is an extrapolation, not a measurement. Under serial handling of requests, a 4 vCPU machine can produce 1.41 proofs per second at k=6 (Intel 8573C) to 1.58 proofs per second (Neoverse-N2).
In the UK, CHAPS in fiscal year 2025 processes an average of 210,483 transactions per day. The settlement window is 06:00 to 18:00 on each business day—spread across 12 hours, that’s about 4.87 transactions per second, requiring 3.1 to 3.4 machines like this. The single-day record documented in the Bank of England’s Dec 2021 RTGS and CHAPS overview is 320,034 transactions on March 29, 2018, which over the same window is about 7.41 per second, requiring 4.7 to 5.3 machines. In the US, Fedwire processes an average of 869,187 transactions per day in 2025; assuming 22 hours of operation per day, that’s about 10.97 per second, requiring 6.9 to 7.8 machines.
These numbers are only a first-order estimate of the compute required for proof generation, not Rayls’s settlement throughput. They don’t account for daytime peak load, network overhead, or ledger overhead, nor do they test running multiple proofs in parallel on the same machine. Also, the proofs are generated independently by the initiating institutions, distributing load across institutions rather than concentrating it on a single server.
Not decided yet.
This time I only measured the transfer circuit; I didn’t measure the deposit, withdrawal, or DvP circuits. The keys were generated locally using the repository’s own groth16.Setup. The Rayls repository documentation also states that the key material in the repository is also a single-party-generated development/testing artifact; production deployment requires an additional multi-party trusted setup. The proving time depends on the circuit structure and is not related to the specific numerical values of the keys. In the Rayls production environment, what hardware is used and what the anonymity set size is set to—based on publicly available information, I couldn’t find that, so the number of machines above only indicates the order of magnitude.
My take
For the compute accounting of a zero-knowledge private transfer, the magnitude is actually not that big: with 1 vCPU, it’s within two seconds; with 4 vCPUs, it’s under one second, and the verification overhead is almost negligible. There are two things to pay real attention to. First, when the size of the anonymity set crosses the threshold of a power of 2, the cost suddenly jumps. Second, the first request needs to read the key(s) first, which takes a few seconds (2–3 seconds).
The criteria are also straightforward: anyone can open the Enygma-bench repository’s Actions page and run it again to see whether the numbers on their obtained CPUs fall within the same range. If Rayls later discloses the proof hardware used in production, you can directly use this test suite for comparison.
Reference sources:
Rayls proof service source code: raylsnetwork/rayls-sovereign-gnark-api, commit 67c4c26 (Aug 20, 2026): https://github.com/raylsnetwork/rayls-sovereign-gnark-api/commit/67c4c26696016b48e70950e284ae1a51b7d0cf0e
This article’s test code and all logs, running 37741247183 via Actions (Oct 8, 2026): https://github.com/hansonhan0520-lang/enygma-bench
GitHub hosted runner specs (checked on Oct 8, 2026): https://docs.github.com/en/actions/reference/runners/github-hosted-runners
Fedwire Funds 2025 statistics (page updated Jan 26, 2026): https://www.frbservices.org/resources/financial-services/wires/volume-value-stats/annual-stats.html
Bank of England payment and settlement statistics, CHAPS FY2025 daily average number of transactions: https://www.bankofengland.co.uk/payment-and-settlement/payment-and-settlement-statistics
Bank of England (RTGS and CHAPS overview) (Dec 2021), CHAPS single-day record: https://www.bankofengland.co.uk/-/media/boe/files/payments/rtgs-chaps-brief-intro.pdf