


#sp500andnasdaqhitrecordhighs Index performance charts and technical analysis
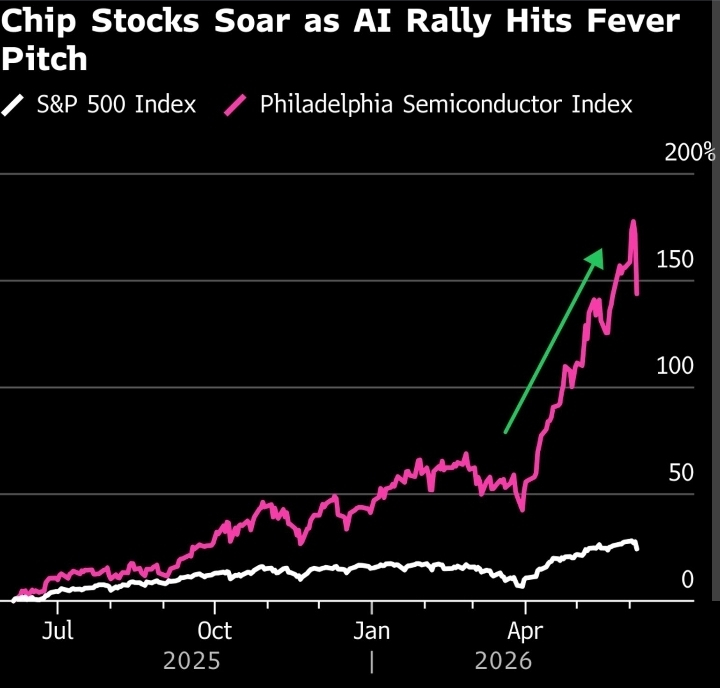
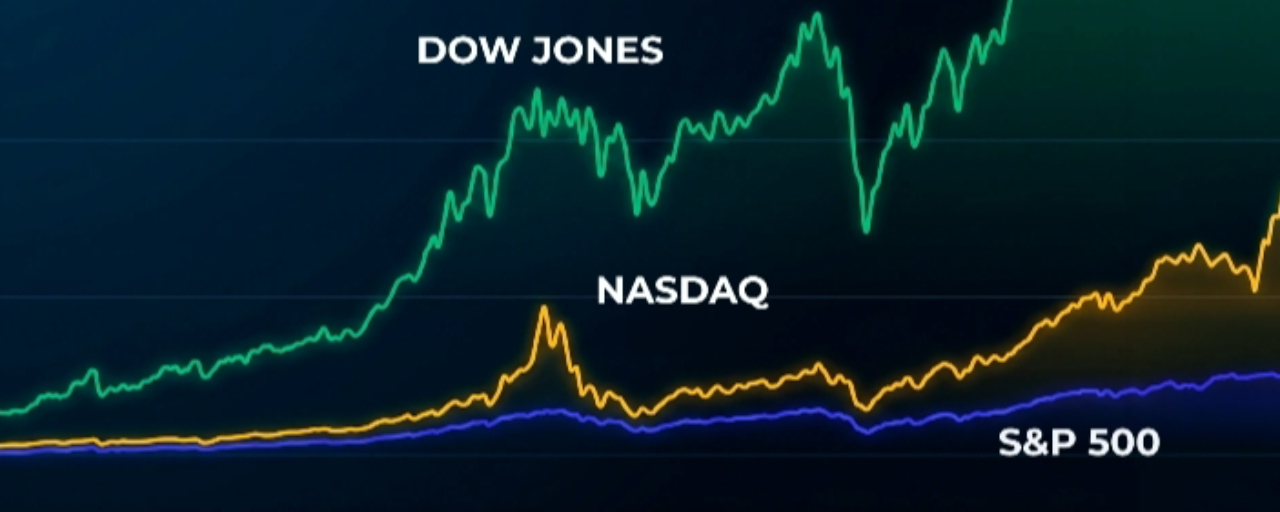
Stock market charts and statistical graphs show a bullish breakout by the S&P 500 and Nasdaq indexes, surpassing the moving averages tracked by institutional investors. The Wall Street rally reached a historic milestone at the close of trading, with both indexes hitting unprecedented new record highs, driven by enormous demand for AI infrastructure and stable crude oil prices. The benchmark S&P 500 rose 0.58% to 7,818.93, successfully breaking through its previous resistance level set in August. The gain was supported by energy and semiconductor companies such as Marvell Technology and Constellation Energy—the latter’s shares surged 12.3% after it signed a major power supply deal with Alphabet. Meanwhile, the tech-heavy Nasdaq Composite climbed 0.45% to close at 27,599.79, setting another consecutive record, led by six of the Magnificent Seven stocks, which topped market buying activity.
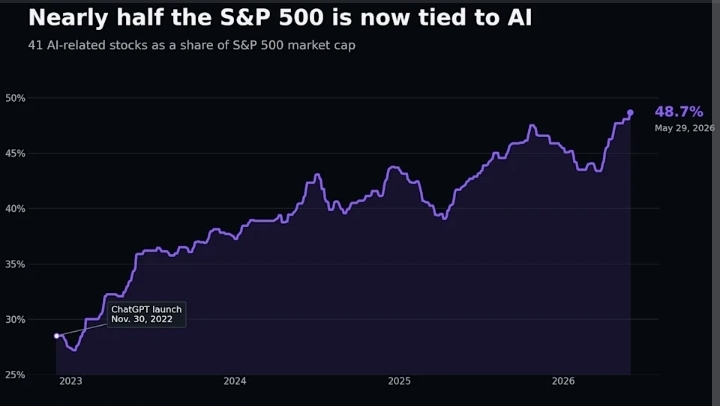
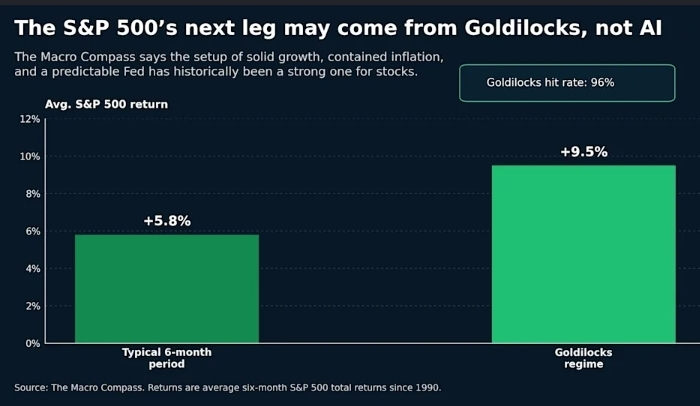
This historic rally—which dominated discussion under the hashtag #sp500andnasdaqhitrecordhighs—surprised many institutional analysts, as it comes amid unusually high yields on 10-year Treasury bonds, hovering around 5.28%. Traders chose to set aside concerns about the Federal Reserve’s tight monetary policy and focus instead on optimistic forecasts for the third-quarter earnings season, which point to a 30.6% overall increase in earnings per share for companies in the S&P 500. However, investment firms warn of the risks inherent in the market’s narrow breadth—that is, the rally’s concentration in a limited number of stocks. They note that the heavy concentration of capital in mega-cap technology companies and their associated energy suppliers leaves individual investors’ portfolios vulnerable to sharp bouts of volatility if upcoming corporate results disappoint and fail to justify these unprecedented valuations.