

Yesterday, a huge bearish candle sent prices plunging, liquidating more than 124,000 long traders, with losses totaling as much as $400 million. So far, there are no signs that the decline is letting up, which is certainly painful for those who are long. But chasing shorts at these levels is off the table. We missed the chance to short from higher levels, and now that prices have already fallen, chasing them would just mean buying high and selling low. The head, back, and belly of the fish—the meat—have all been eaten, leaving only the tail, with lots of bones and little meat. It’s not worth it…
For BTC, the support below is around the previous low near 82,500. Recently, it has been trading in a range between 87,000 and 82,500. The test of resistance at 87,000 failed to break through, and the price pulled back. Now, it’s testing whether support at 82,500 will hold. On the daily chart, the Bollinger Band middle and lower bands are both turning upward and opening out, but the upper band is sloping downward. Yesterday’s huge bearish candle plunged straight through the middle band. Both the KDJ and RSI have turned down, while bearish momentum on the MACD continues to expand. At present, there really are no signs that the decline is letting up. On the 4-hour chart, we haven’t even seen a single small bullish candle; nine bearish candles are lined up in a row. The occasional small bounce on the hourly chart looks too weak to count as a recovery—it hasn’t even broken through the middle band.
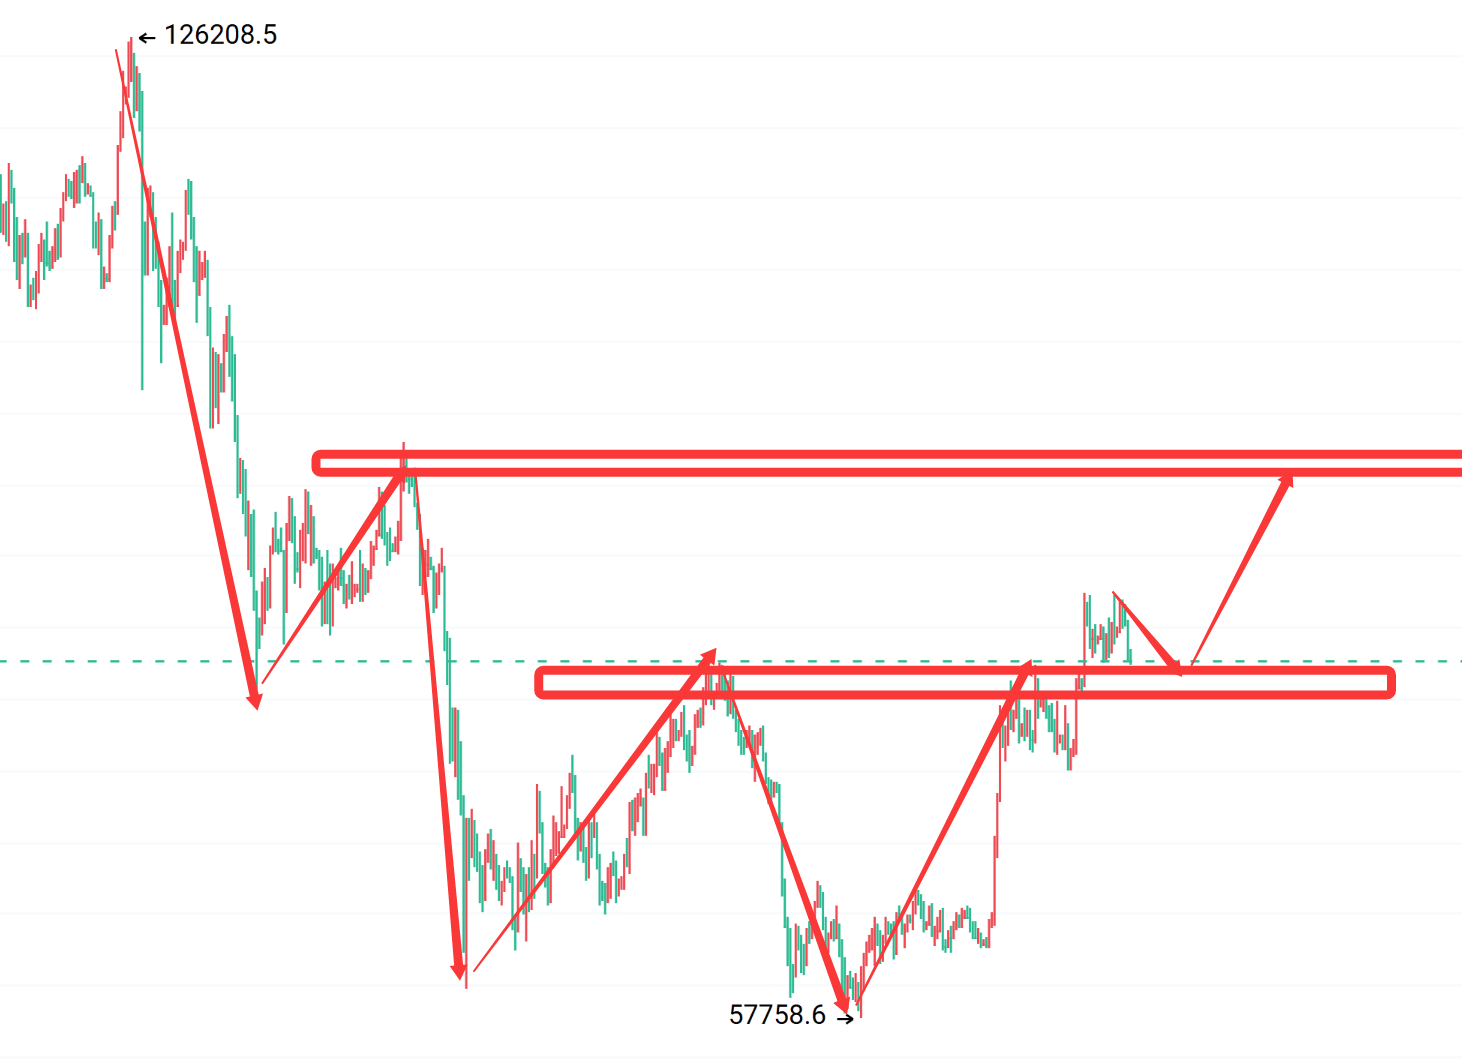
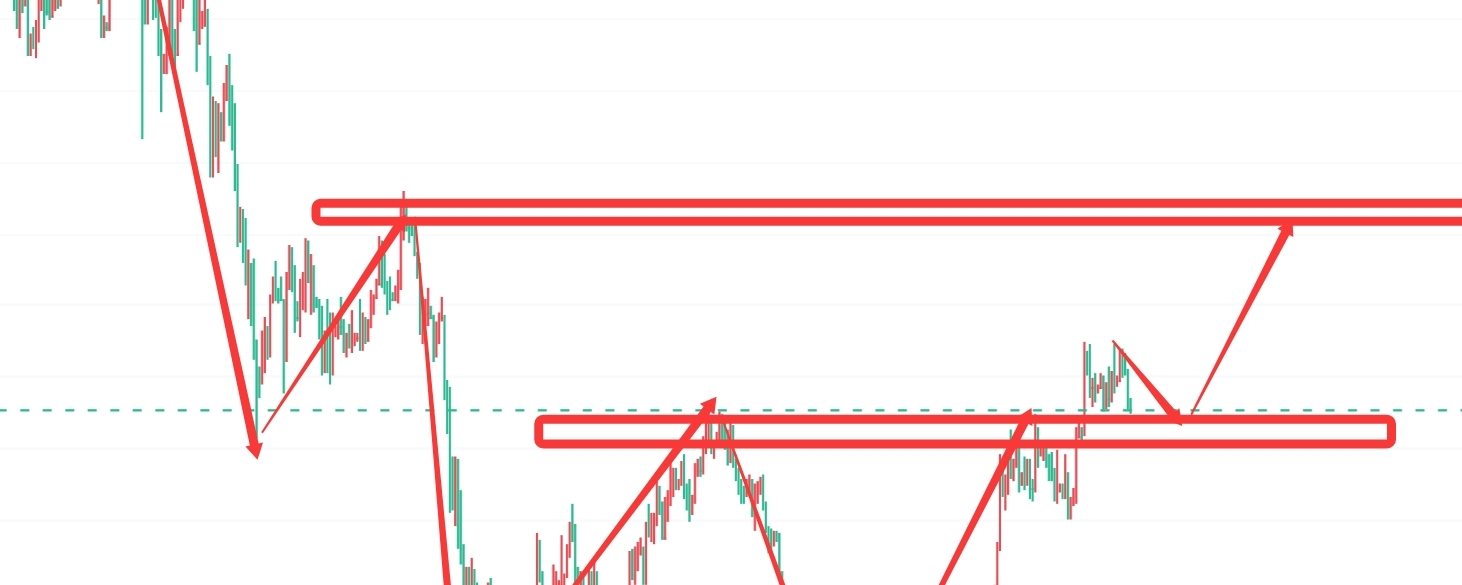
But take a broader view: on the weekly chart, after three consecutive bullish candles pushed the price along the upper band, the band continued to widen upward. There wasn't enough room for further gains for the time being, which is why the price pulled back from higher levels. On the monthly chart, after three consecutive bullish candles, the rebound tested resistance at the middle band. With resistance at two levels on the larger time frame, the price underwent a deep pullback. However, this rebound is the second wave of an upward move in a five-wave structure, and that structure remains intact. During the decline from the high of 124,000, the price fell in three waves, then found support at the bottom at 57,700 and rebounded. The high of the second wave corresponds to around 96,000, while the extreme range for this pullback—80,000 to 78,000—is the bottom!
Using historical pullback sizes as a reference, BTC rose from 64,500 to a high of 87,300, with two pullbacks along the way. The first fell from 81,500 to 76,100, a 5,400-point pullback; the second fell from 82,200 to 74,900, a 7,300-point pullback. With this cycle's high at 87,300, applying similar pullback sizes gives a support range of 81,900–80,000. This is a rough historical comparison, but those levels are genuine support lows below.
If the market makes a small pullback and continues to move sideways, it may find support around 82,500. But if the initial jobless claims tonight trigger another drop, then look to buy the dip around 80,000 and 78,000. There's plenty of room above: the previous rebound high of 87,000 is a good level to trim part of your position, with 96,000 as the next target.
If you're stuck in long positions from earlier, manage your position size. If you want to add to your position, do so again around 80,000–78,000. If your position is large, don't make any moves—safety comes first. If you don't think you can hold on, you can also cut losses on part of your position. If you think the market will keep falling, reverse course and open short positions.
If you don't have any long positions, it's even easier to plan. For BTC, build long positions in batches around 82,500–80,000–78,000, with upside targets at 85,000–87,000–90,000–96,000.
For ETH, build long positions in batches around 2,530–2,450–2,380, with upside targets at 2,650–2,800–3,000–3,300.