【$ETH Under the Spotlight: How Well Are Price and Volume Aligned? Range Plan Included】
【Hot Event】
When a trending event and market action resonate, it’s worth reviewing the data and news together.
「Ethereum ETFs Lose $201.9 Million As Bitcoin Funds Return To Inflows」——NewsBTC reported that US spot Ethereum ETFs recorded $201.9 million in net outflows on October 6, according to Farside Investors.
News drives volatility; structure determines direction. Both matter.
【Market Snapshot】
$ETH is currently at 2,586, down 3.98% over 24 hours, with 24-hour trading volume of approximately 1.2B USDT.
【Technical Breakdown】
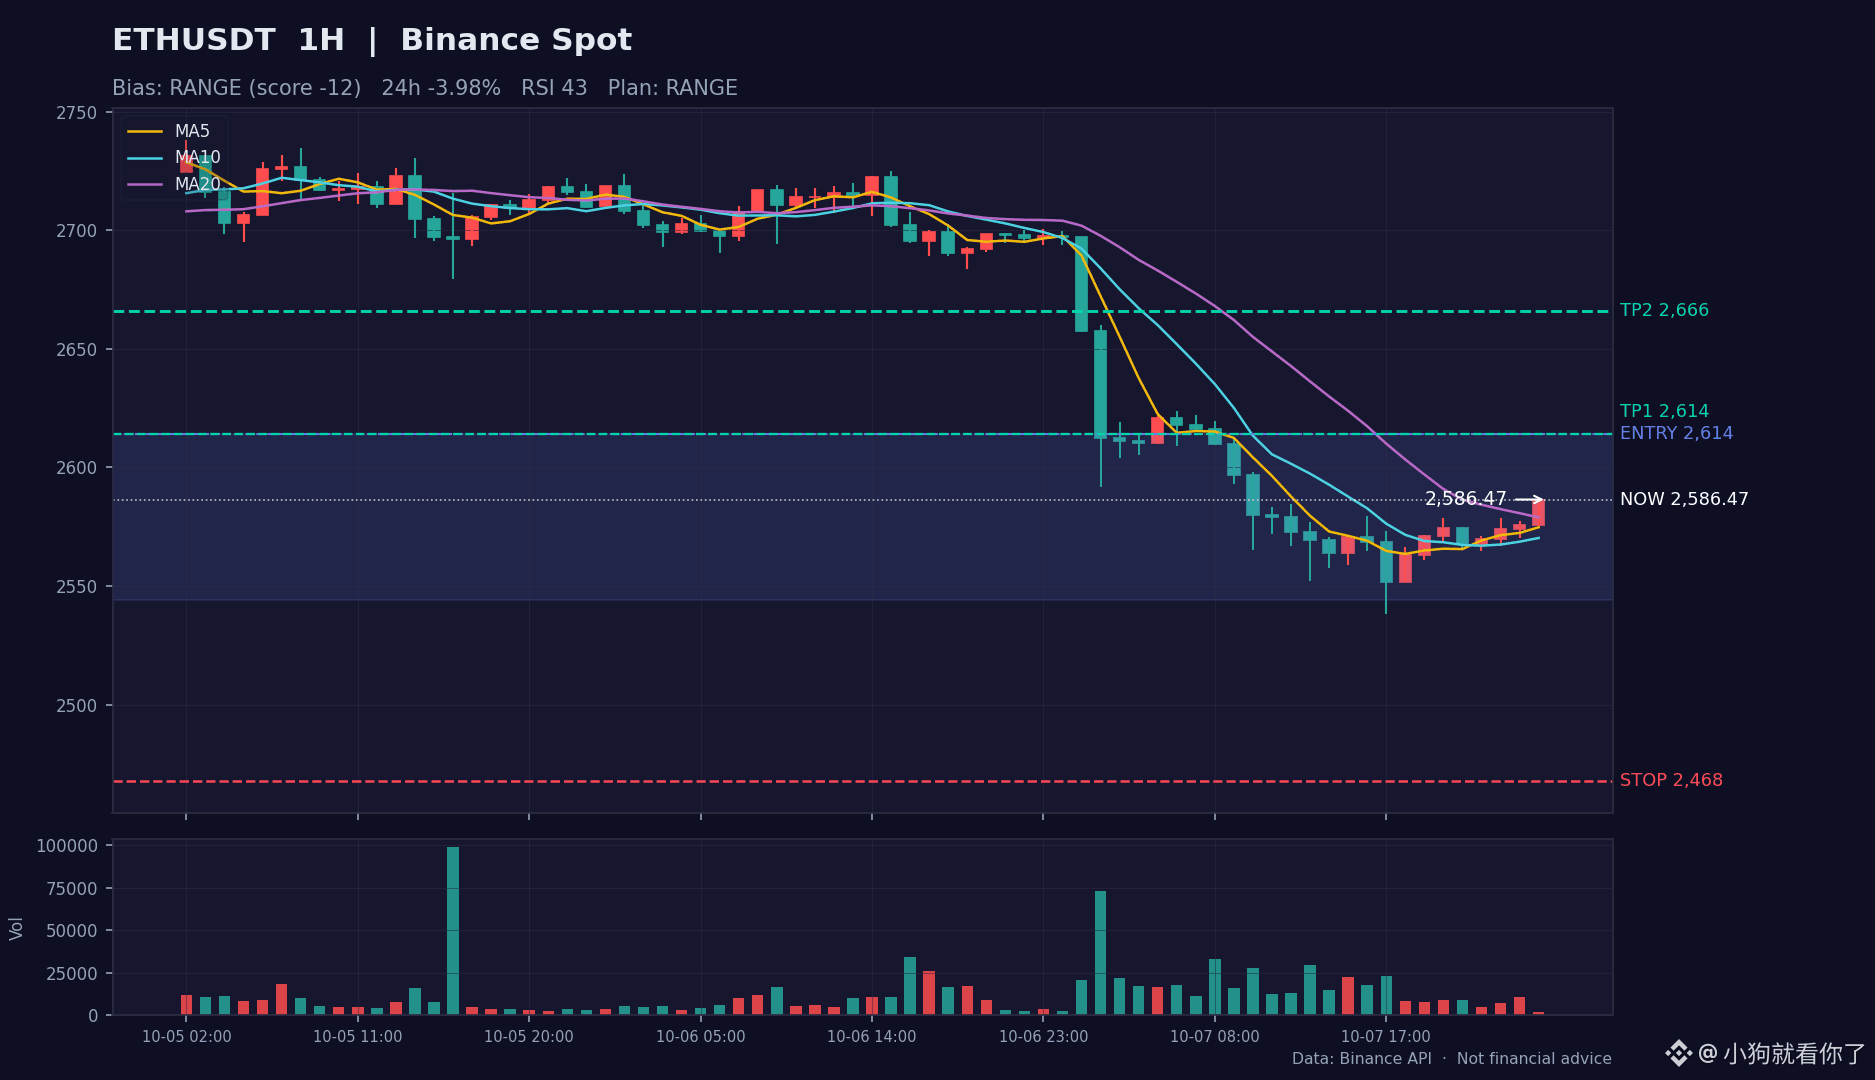
· Moving averages: Short-term moving averages have formed a bullish crossover, and price has moved back above MA20. The trend is recovering, but MA60 has yet to be reclaimed.
· Momentum: The MACD fast line is above the zero line, with bullish histogram bars prevailing, so bullish momentum is continuing. RSI (43) is weak; a rebound needs confirmation from increased volume.
· Pattern: Price is moving around the Bollinger middle band, whose support or loss will set the short-term pace. Volume has contracted (to 0.1 times the average), so directional signals should be treated with caution in these low-volume conditions.
【Directional View】
Overall score: -12/100. Bulls and bears are locked in a tug-of-war: indicators are conflicting, so chasing trades is especially ill-advised. Consider a range-bound approach, using small positions to sell high and buy low near the boundaries. Follow the trend only after direction is confirmed by a high-volume breakout above or below the range.
【Trade Plan Reference】
· Strategy: Range-bound
· Entry zone: 2,544 ~ 2,614
· Take profit: First target 2,614; second target 2,666
· Stop loss: 2,468
· Position sizing: Use small positions to sell high and buy low within the range; follow the trend after a breakout.
· Chart: Candlestick analysis chart included in the post (1-hour chart; red for up, green for down; entry zone, take-profit, and stop-loss levels are marked with colored lines)
【Risk Warning】Data reflects probabilities, not a script. If any planned level is breached, exit first and reassess the rationale.
This is solely my personal review and technical analysis record, and does not constitute investment advice. DYOR.
$ETH #ETH #加密货币 #MarketAnalysis
【Hot Event】
When a trending event and market action resonate, it’s worth reviewing the data and news together.
「Ethereum ETFs Lose $201.9 Million As Bitcoin Funds Return To Inflows」——NewsBTC reported that US spot Ethereum ETFs recorded $201.9 million in net outflows on October 6, according to Farside Investors.
News drives volatility; structure determines direction. Both matter.
【Market Snapshot】
$ETH is currently at 2,586, down 3.98% over 24 hours, with 24-hour trading volume of approximately 1.2B USDT.
【Technical Breakdown】
· Moving averages: Short-term moving averages have formed a bullish crossover, and price has moved back above MA20. The trend is recovering, but MA60 has yet to be reclaimed.
· Momentum: The MACD fast line is above the zero line, with bullish histogram bars prevailing, so bullish momentum is continuing. RSI (43) is weak; a rebound needs confirmation from increased volume.
· Pattern: Price is moving around the Bollinger middle band, whose support or loss will set the short-term pace. Volume has contracted (to 0.1 times the average), so directional signals should be treated with caution in these low-volume conditions.
【Directional View】
Overall score: -12/100. Bulls and bears are locked in a tug-of-war: indicators are conflicting, so chasing trades is especially ill-advised. Consider a range-bound approach, using small positions to sell high and buy low near the boundaries. Follow the trend only after direction is confirmed by a high-volume breakout above or below the range.
【Trade Plan Reference】
· Strategy: Range-bound
· Entry zone: 2,544 ~ 2,614
· Take profit: First target 2,614; second target 2,666
· Stop loss: 2,468
· Position sizing: Use small positions to sell high and buy low within the range; follow the trend after a breakout.
· Chart: Candlestick analysis chart included in the post (1-hour chart; red for up, green for down; entry zone, take-profit, and stop-loss levels are marked with colored lines)
【Risk Warning】Data reflects probabilities, not a script. If any planned level is breached, exit first and reassess the rationale.
This is solely my personal review and technical analysis record, and does not constitute investment advice. DYOR.
$ETH #ETH #加密货币 #MarketAnalysis