



From a volume-backed recovery to gains being given back: how bullish expectations are put to the test
A BTC 4-hour candle first dipped, then rebounded sharply, closing almost at its high, with a noticeable increase in volume. When you see a rebound like this, it’s easy to wonder: does this mean the price is about to keep climbing? #BTC
Reading the original case study on “the market’s self-negating behavior,” I wanted to take this question one step further: even after a strong rebound—and even if the price makes new highs—we still need to see whether those gains can hold. Let’s walk through what happened next using a real stretch of BTC price action.
A’s rebound deserves to be taken seriously
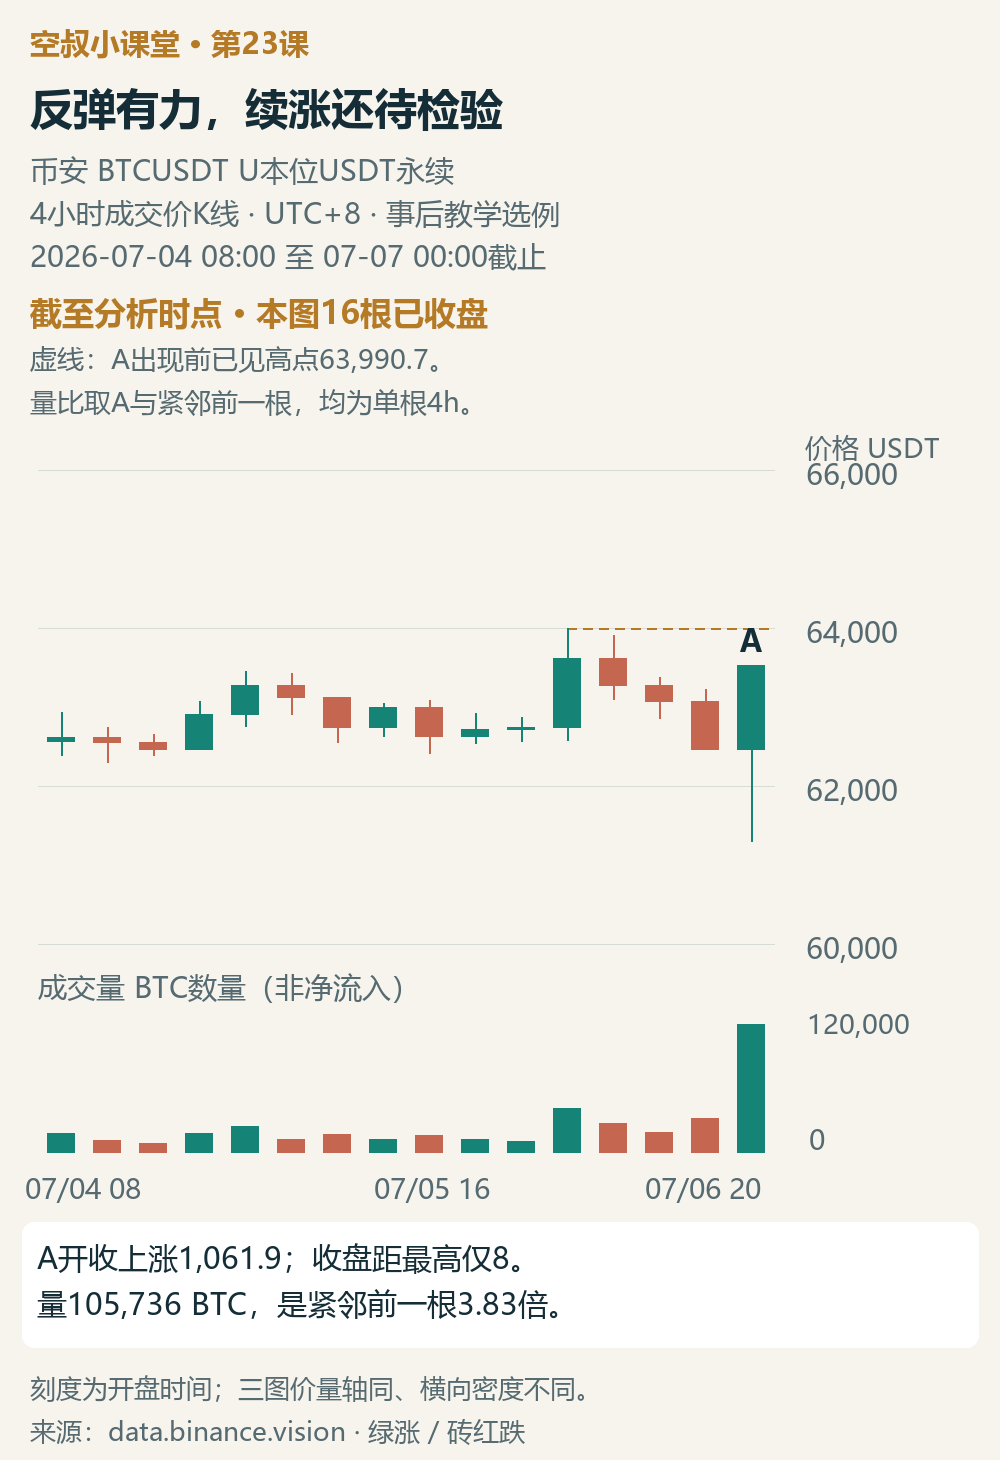
Figure 1 | Through A’s close: volume increased, and price responded clearly to the upside
These are 4-hour Binance BTCUSDT USDT-margined perpetual contract price candles, all shown in UTC+8. This is a retrospective teaching example. Figure 1 starts at July 4, 2026, 08:00, and shows only the 16 completed candles through July 7, 00:00.
Price had moved higher before pulling back. A is the candle that opened at 20:00 on July 6: after dipping intrabar, it recovered, rising about 1,062 USDT from open to close and closing at 63,523.1, almost at the candle’s high. Its volume was 3.83 times that of the immediately preceding candle; this compares the volume of individual candles on the same timeframe.
Volume increased, and price responded clearly to the upside. At this point, there was a basis for expecting the recovery to continue. We shouldn’t look back at the later weakness and claim that the improvement at A never existed.
But A has not yet moved above the previous high of 63,990.7. If price moves above this high and holds, the case for a bullish view would strengthen; if the gains gradually unwind back toward A’s open, around 62,461, the situation would need to be reassessed. These are reference points for observing this example, not trading parameters.
This is also where the book’s lesson applies: the author first recognizes the strong recovery after the dip, interprets it alongside volume as strong demand and selling being absorbed, and expects a new high. Only after two subsequent strong advances fail to produce the expected progress does the author emphasize that supply remains strong. The basis for a bullish view needs continued confirmation from subsequent price action. “Selling being absorbed” is the author’s interpretation of the example; high volume alone cannot prove it.
B advanced, but C failed to build on those gains
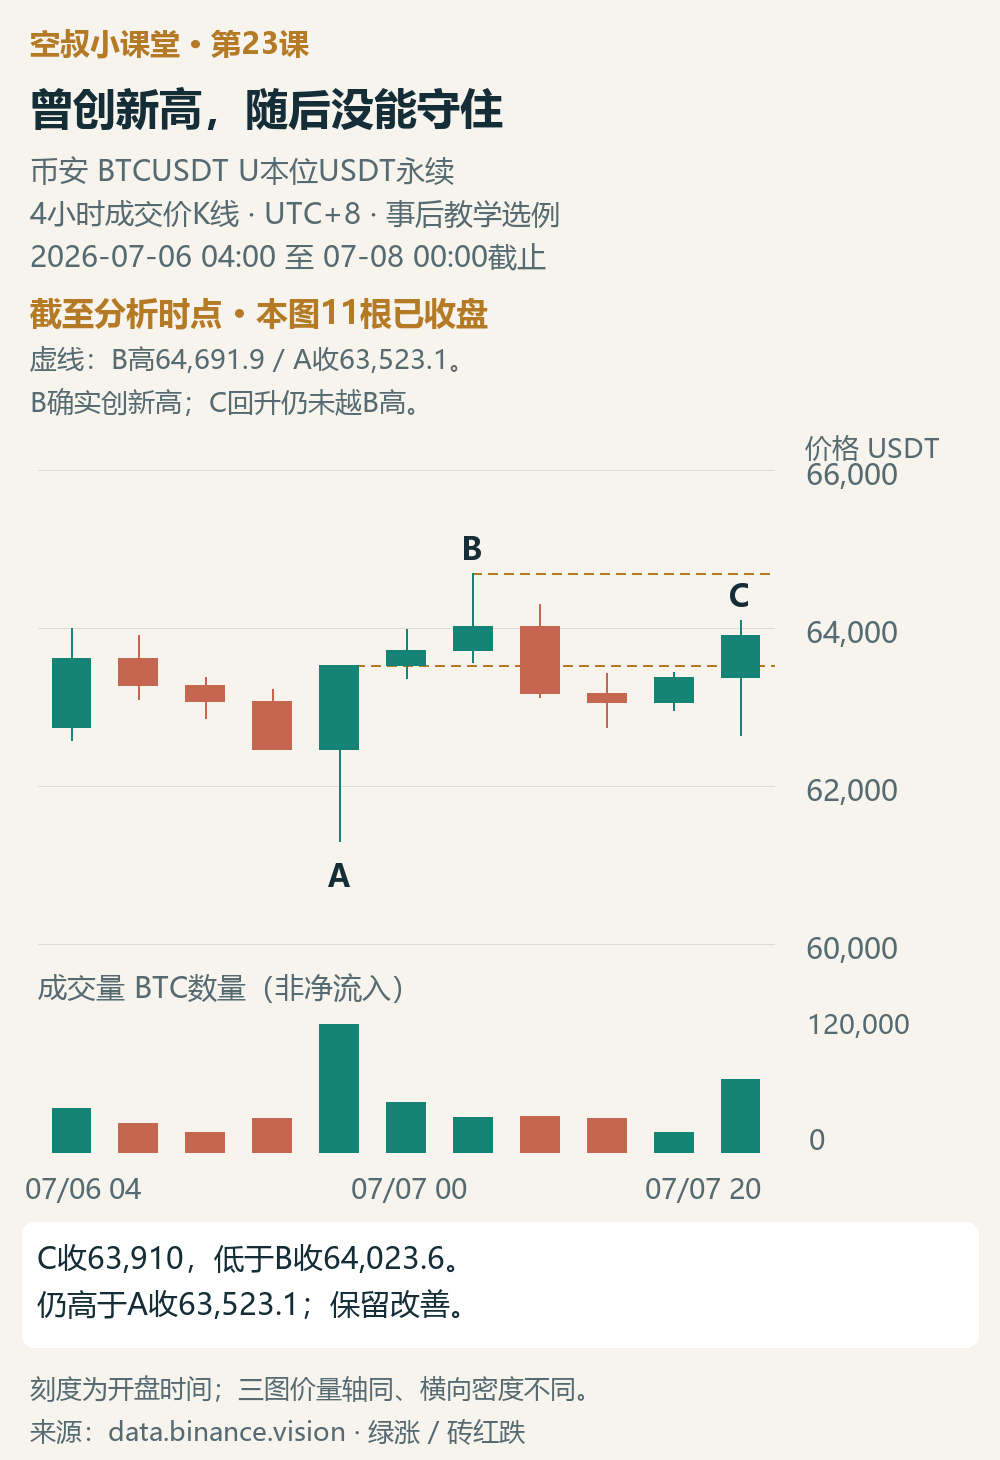
Figure 2 | Through C’s close: B reached a new high, but C’s rebound after the pullback has not resumed that advance
Only July 8, 00:00 is visible now. Figure 2 zooms in on the 11 bars since July 6, 04:00, and Figure 3 starts there too. The price and volume axes are the same across all three figures; the horizontal density differs, so wider-looking candles do not indicate greater strength.
After A, price did continue to rise. By B, it had reached a high of 64,691.9 and closed above the previous high shown in Figure 1. The expectation of further gains had received some support. This differs from the book’s example, where new highs did not follow two strong advances; BTC’s improvement here should be acknowledged.
Afterward, price pulled back from B. At C, it dipped again and then recovered; volume was 3.69 times that of the immediately preceding candle, and the close was near the top of the candle.
Viewed alone, C is another strong rebound; in context, both its high and close are below B’s, so it has not yet resumed the previous advance. At this point, what matters is not just whether there is a strong rebound, but whether price can move higher and hold on to those gains after each rebound.
At this point, I would lower my expectation of a smooth continuation after the strong rebound, while still acknowledging the improvement that C’s close remains above A’s close. Failure to resume the advance does not mean all the rebound’s gains have been lost, much less that price must fall.
If price moves above B’s high and holds there, the case for a bullish view could strengthen. If it loses even A’s closing level and continues to give back gains toward A’s opening level, the case for a bullish view would weaken. Adjust the assessment based on how price actually progresses; there is no rule that a breakout must happen within a set number of candles.
The subsequent pullback weakened the case for a continued bullish view
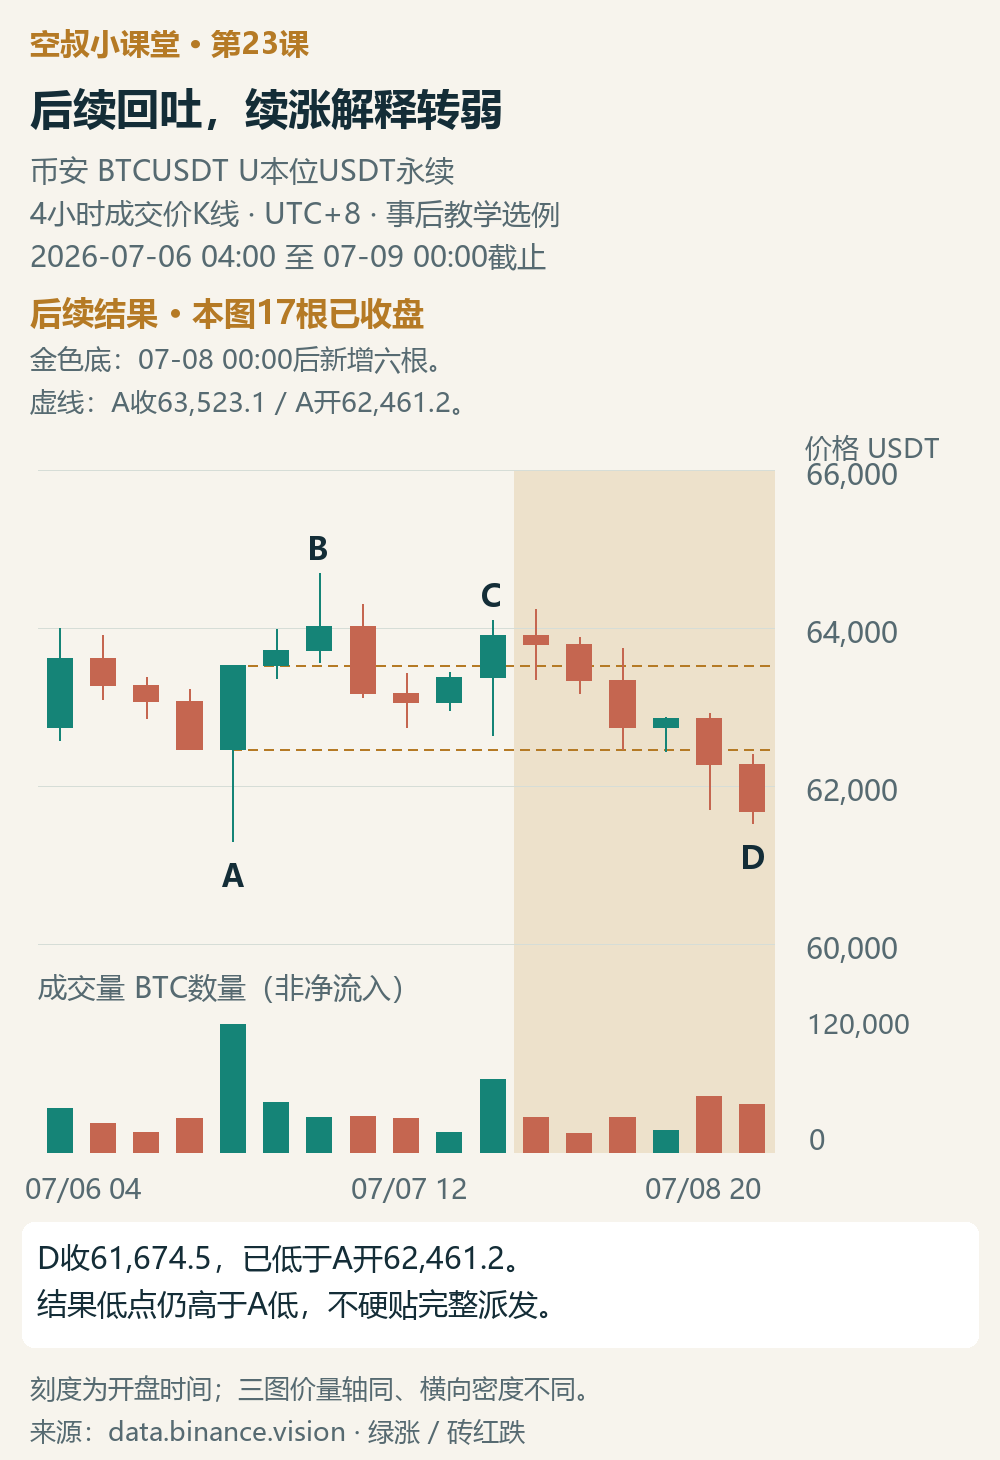
Here we reveal the outcome through July 9, 00:00. The gold area shows the six new candles after C; this information was not used in the first two observation figures.
The first candle still closed above A’s close, but then price closed below that level. Although there was a small rebound in between, price did not reclaim A’s close. It then continued lower, with D closing at 61,674.5, already below A’s opening level.
Now there are specific reasons to adjust the assessment: B reached a new high, but the gains were not sustained; C rebounded again, then even the gains since A’s open were given back. Compared with when we had only seen C, the evidence supporting a continued bullish view has clearly weakened.
The low after C is still above A’s low. This example supports the conclusion that “this attempt to resume the uptrend failed to hold,” but it is not enough to confirm a complete distribution or the end of the entire bull market.
My learning notes
What I want to remember from this lesson is: first acknowledge the improvement brought by a rebound, then see whether progress continues. Reaching a new high only tells us how far price once got; whether it can hold on to those gains still needs to be observed. When the subsequent evidence changes, the assessment should change too.
If an existing long position reaches a pre-determined risk exit condition, there is no need to wait for distribution to be confirmed conclusively; exiting a long position does not automatically mean going short. This is an addition to the series. This lesson does not add rules for entries, stop-losses, or candle counts.
A quick exercise
Looking only at Figure 2, without using Figure 3: why is C’s high-volume rebound still not enough to support the claim that “the uptrend has resumed smoothly”? Point to one piece of evidence that progress has been insufficient, one improvement that should still be acknowledged, and one possible subsequent development that would further weaken the continuation-of-the-uptrend interpretation.
Share the reasoning behind your answer in the comments—don’t just say “up” or “down.” I’ll add a reference explanation to the comments on this post later.
On the trading journey, Uncle Kong is here to grow alongside you.